- Posted By: james w
- Category: Market News
Forex Traders Eye AUD/USD Amid Market Volatility
The AUDUSD currency pair, commonly known as the “Aussie,” represents the exchange rate between the Australian dollar and the U.S. dollar. As of November 5, 2024, the pair is influenced by several key factors. The U.S. presidential election has introduced uncertainty, with polls indicating a tight race between candidates, potentially impacting market volatility and the U.S. dollar’s strength. Additionally, the Reserve Bank of Australia (RBA) is expected to maintain its cash rate at 4.35%, reflecting steady economic growth and persistent core inflation. These events are likely to affect the AUD/USD exchange rate in the near term.

Chart Notes:
• Chart time-zone is UTC (+02:00)
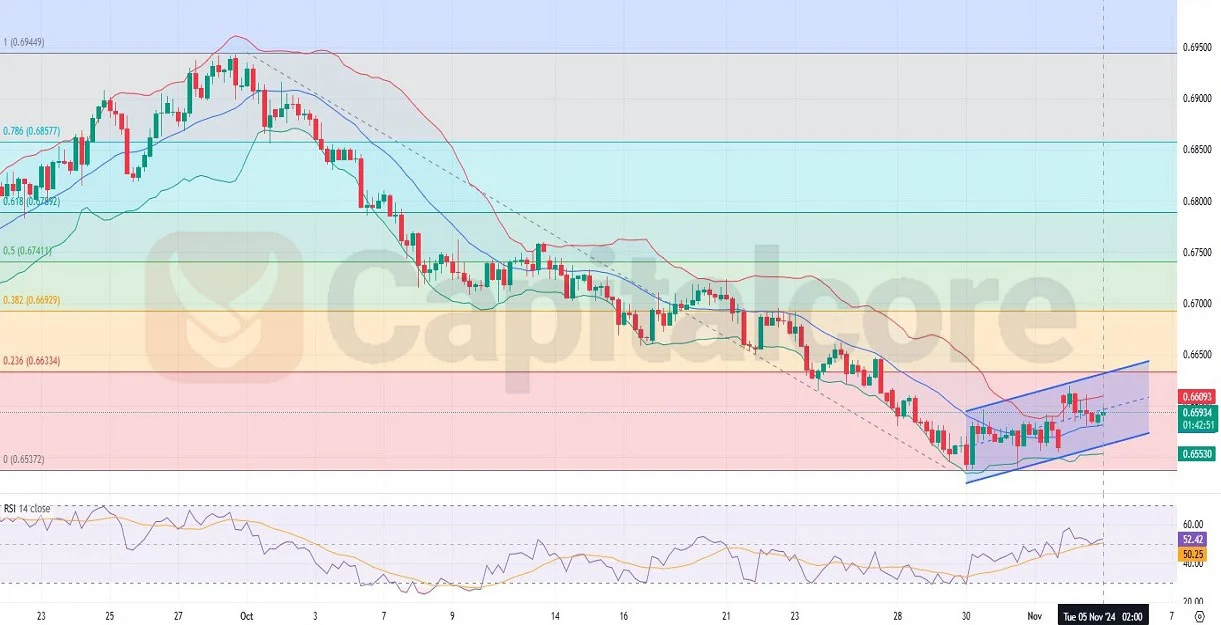
• Candles’ time-frame is 4h.
Analyzing the AUD/USD 4-hour chart, the pair has been in a bearish trend but is showing signs of reversal. Out of the last 25 candles, 12 have been positive, including the most recent two, indicating bullish momentum. The price is currently moving between the 0 and 0.236 Fibonacci retracement levels, approaching the 0.236 line, suggesting potential upward movement. The current candle is positioned in the upper half of the Bollinger Bands, and the Relative Strength Index (RSI) is trending upwards, reinforcing the bullish outlook.
•DISCLAIMER: Please note that the above analysis is not an investment suggestion by “Capitalcore LLC”. This post has been published only for educational purposes.