- June 27, 2023
- Posted By: capadmin
- Category: Market News
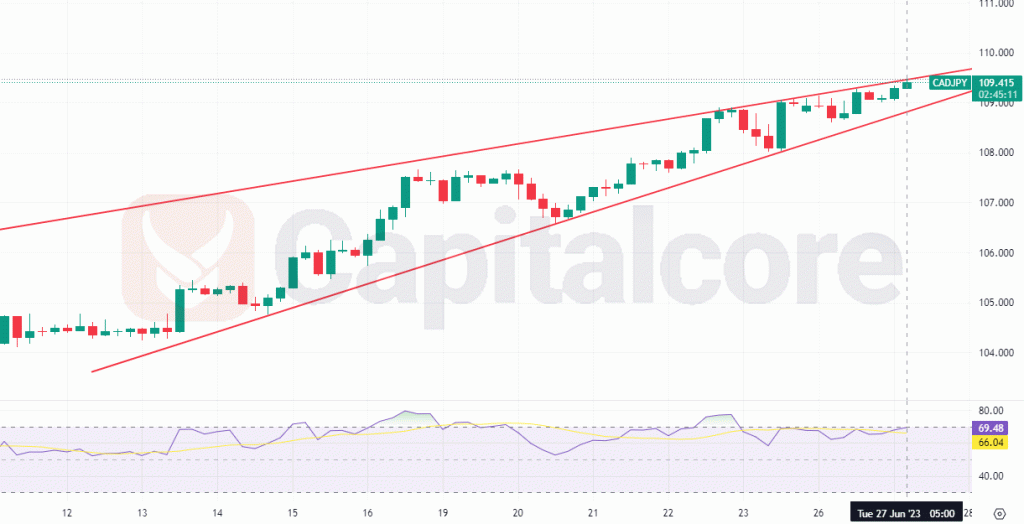
Timing Entry Points for Shorts

Chart Notes:
• Chart time-zone is UTC (+03:00)
• Candles’ time-frame is 4h.
Traders analyzing the CAD/JPY currency pair should take note of the ascending wedge pattern and negative RSI divergence as potential indicators for a bearish market outlook. The ascending wedge pattern, with its converging trendlines, presents a technical formation that often precedes a downward price reversal. As the price reaches higher swing highs and higher swing lows, the narrowing range suggests a loss of bullish momentum and potential exhaustion in buying pressure. Furthermore, the negative divergence on the RSI indicator further supports the notion of an impending trend reversal. The RSI’s lower highs, despite the price forming higher highs, indicate a weakening strength of the uptrend. This discrepancy between price action and momentum serves as a warning sign for traders.
• DISCLAIMER: Please note that the above analysis is not an investment suggestion by “Capitalcore Ltd”. This post has been published only for educational purposes.