Bearish Trends on the Horizon
As one of the most actively traded currency pairs in the forex market, USD/JPY is highly sensitive to economic and political developments in both the US and Japan. Traders often use technical analysis, such as chart patterns and technical indicators, to identify potential entry and exit points and manage their risk when trading USD/JPY.
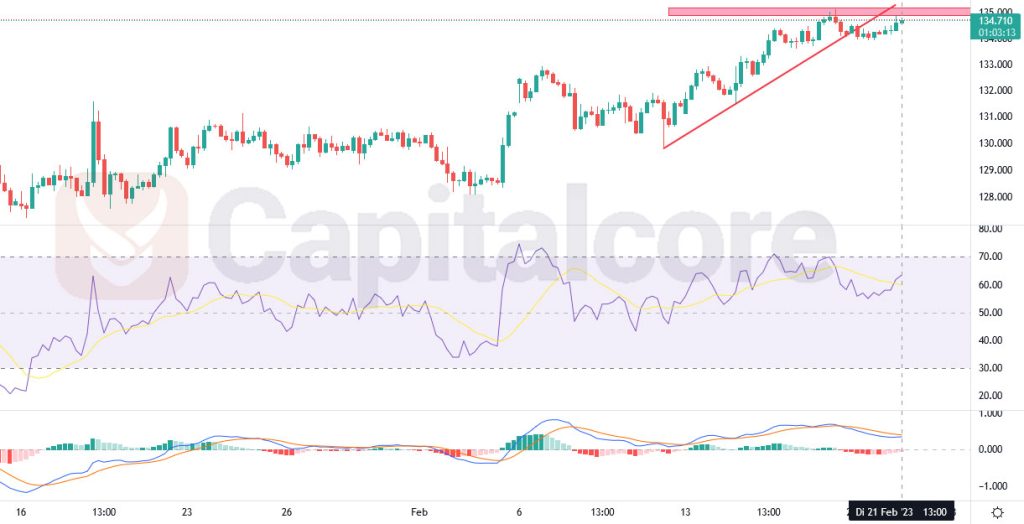
Chart Notes:
• Chart time-zone is UTC (+03:00)
• Candles’ time-frame is 4h.
The USD/JPY price has experienced a significant ascent in recent times and is currently facing strong resistance. As the price line has broken below its previously established bullish trend line, indicating a potential reversal in the market sentiment. This is further supported by the negative divergence seen in the Relative Strength Index (RSI) chart, indicating that the bulls might be losing their grip on the market. These technical indicators suggest that a bearish phase could be expected in the near future for the USD/JPY currency pair. Traders and investors should keep a close eye on the market to make informed trading decisions.
• DISCLAIMER: Please note that the above analysis is not an investment suggestion by “Capitalcore Ltd”. This post has been published only for educational purposes.