- Posted By: capadmin
- Category: Market News
Bullish Crossover in Gold Analysis
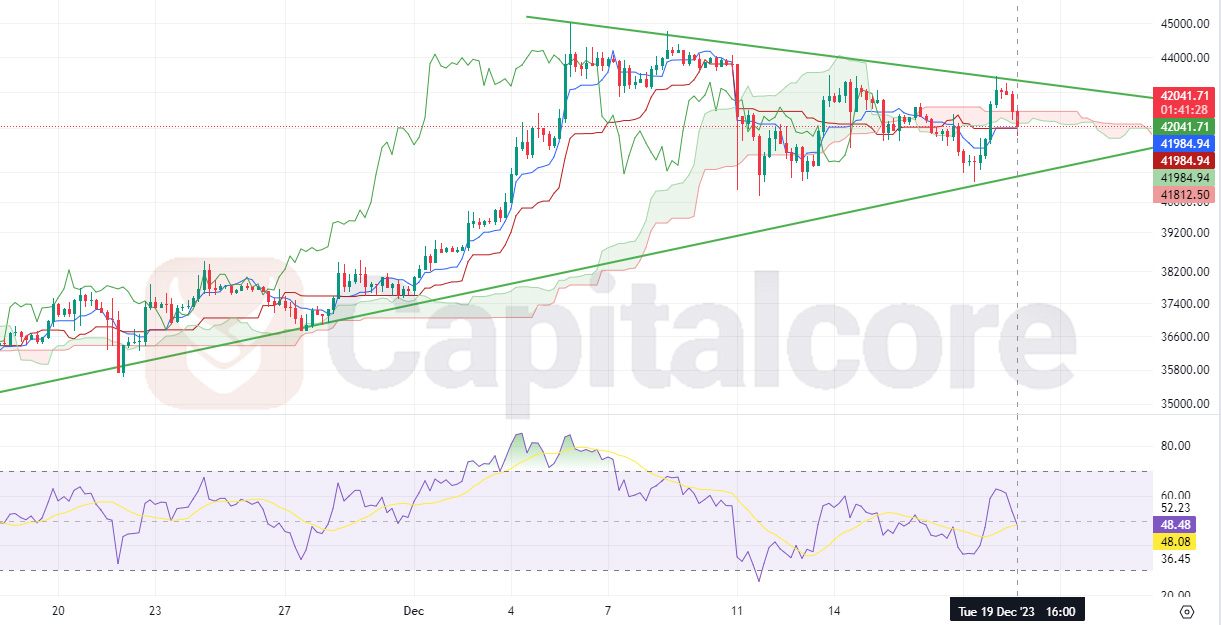
In our latest examination of the Bitcoin market, we notice several optimistic indicators. Specifically, the Ichimoku Cloud is demonstrating bullish signals with the price candles positioned above the cloud. This configuration generally suggests a favorable market trend, as the cloud acts as support for the current price. Traders often interpret this as a strong buy signal, indicating potential for continued growth over the short to medium term, provided the price remains above the Ichimoku Cloud.

Chart Notes:
• Chart time-zone is UTC (+03:00)
• Candles’ time-frame is 4h.
The Relative Strength Index (RSI) further confirms the positive outlook, currently sitting above the 50 level which is often considered a bullish zone. The RSI has not yet reached the overbought territory, which suggests there may be room for further price appreciation before the market becomes overheated.
Combining the insights from the Ichimoku Cloud and RSI, the technical analysis indicates a bullish scenario for Bitcoin. However, it is crucial for traders to consider these indicators alongside other analytical tools and market news when making investment decisions.
• DISCLAIMER: Please note that the above analysis is not an investment suggestion by “Capitalcore Ltd”. This post has been published only for educational purposes.