- Posted By: capadmin
- Category: Market News
BTCUSD Forecast: A 4h Chart Deep Dive
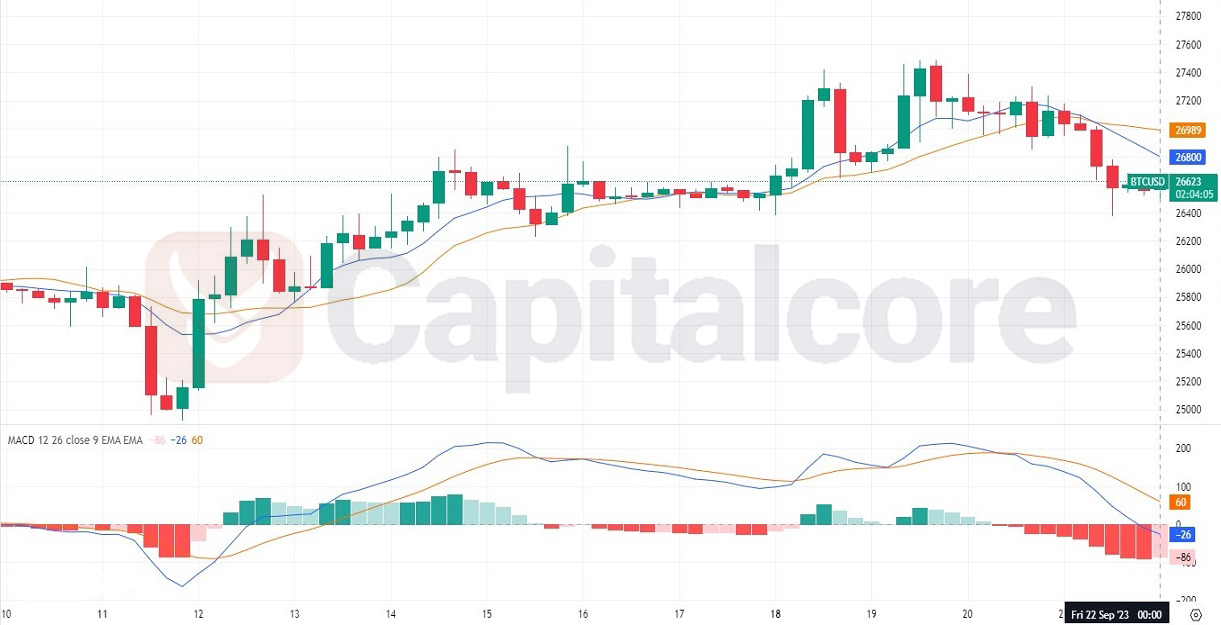
In the ever-evolving landscape of cryptocurrency, BTCUSD remains a benchmark pairing closely watched by traders worldwide. As we delve into its latest 4-hour chart, a mix of technical indicators provides insights into its potential trajectory. Let’s decode these signals to understand the market’s current sentiment and anticipate possible moves.

Chart Notes:
• Chart time-zone is UTC (+03:00)
• Candles’ time-frame is 4h.
The BTCUSD 4-hour chart is currently leaning towards a bearish sentiment. A significant signal is the short-term SMA crossing below the long-term SMA, hinting at a potential downward shift. This is further corroborated by the MACD dynamics. The MACD line, at a value of -26, crossing below the signal line at 60, typically suggests a negative momentum in the market. The considerably low histogram value of -86 emphasizes this bearish trend. Collectively, these indicators suggest that sellers are currently dominating this time frame. Traders should tread with caution and closely monitor any subsequent moves for potential trend confirmations or reversals.
• DISCLAIMER: Please note that the above analysis is not an investment suggestion by “Capitalcore Ltd”. This post has been published only for educational purposes.