BTC price, about to make a significant move
BTC price line has currently been reducing its moving range, after experiencing a big loss against USD. Right now the price line is on a strong support zone and a trend reversal seems probable, as a number of indicators suggest.
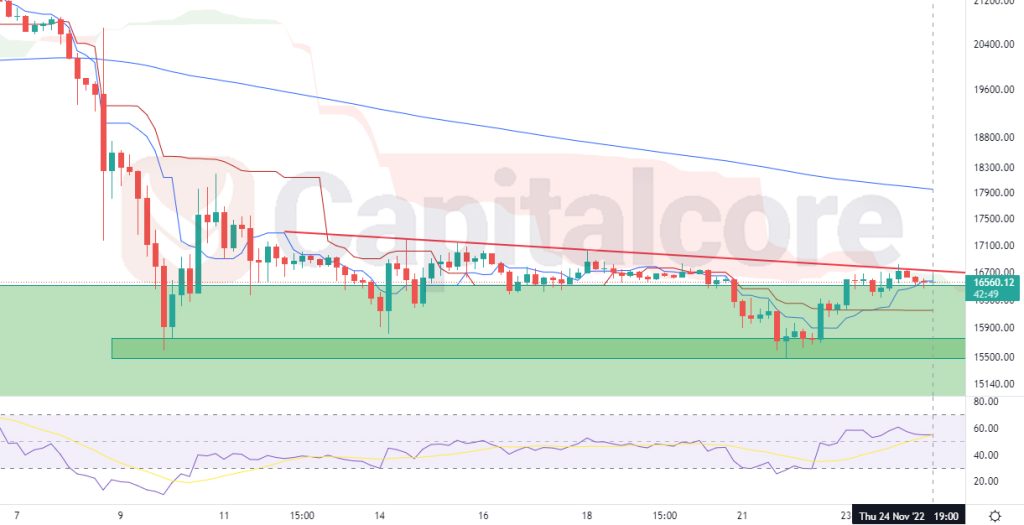
Chart Notes:
• Chart time-zone is UTC (+03:00)
• Candles’ time-frame is 4h.
As the weekly candle approaching its close time, the price line on BTC price chart is continuing its horizontal movement on the static resistance at about 16000. The red descending line on the chart indicates the dynamic resistance which was formed as a result of the smooth movement on this chart and the green area indicates the static support zone. As it can be seen, a descending triangle has been formed on the chart, breaking below or above which, is expected to be followed be a significant bearish or strong bullish wave. Sellers can set their targets on 15000 and 13600 after that; for buyers the target could be considered on 19400 and 21000 after that. Please consider that a bullish, or bearish trigger is essential to take place on the chart, before entering the position.
• DISCLAIMER: Please note that the above analysis is not an investment suggestion by “Capitalcore Ltd”. This post has been published only for educational purposes.