Bearish trend line is broken
USD, started a bearish trend, from the top line of its ascending trend on 28th of March 2022. The bearish wave could cause the price of BTC/USD to descend up to almost 20% and then the price could finally break out of the trend line. At the moment the market is in a sideway range and a smooth bearish trend seems to be forming.
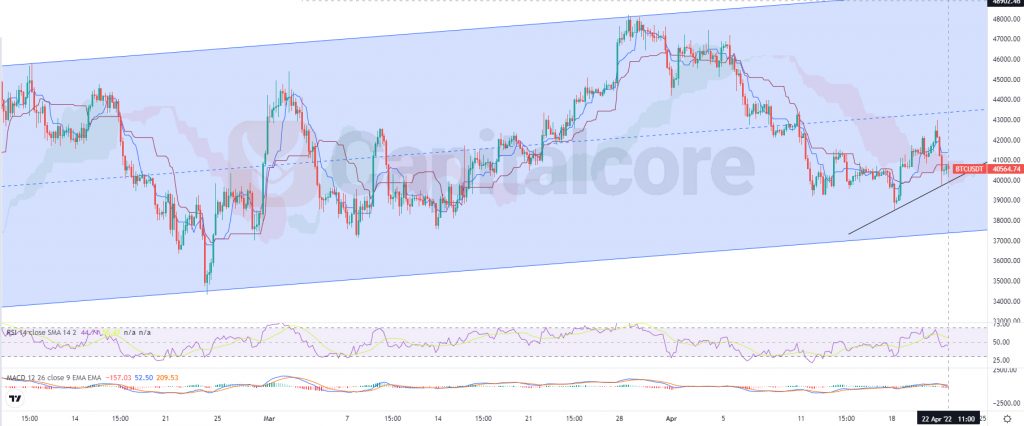
Chart Notes:
• Chart time-zone is UTC (+03:00)
• Candles’ time-frame is 4h.
The price line at the moment is on 40564 at the moment, which would be just above 40k resistance. Two previous valleys indicate that the current tendency of the market is bullish, as the valleys are being formed higher each time; the same thing would be also correct about climaxes. Previous bearish step on the chart was able to pump the price above Ichimoku cloud, how ever the next descending wave dumped the price into the cloud once more, the bearish power wasn’t strong enough to dump the price below it. RSI is also in a bullish trend and the trend line has not broken yet. MACD is showing bearish trend on going . The overall look of the chart is turning bullish currently and traders can expect to soon the price at 45000, and if the bulls are powerful enough, at 50,000 and even more.
• DISCLAIMER: Please note that the above analysis is not an investment suggestion by “Capitalcore Ltd”. This post has been published only for educational purposes.