Bullish signals have been issued
After a significant bullish phase, the price line on BTC price chart entered a correction phase and the price line went through a bearish leg. A demand level then, was formed at almost 22500, which could pump the price line several times. The price line is now once more approaching this level.
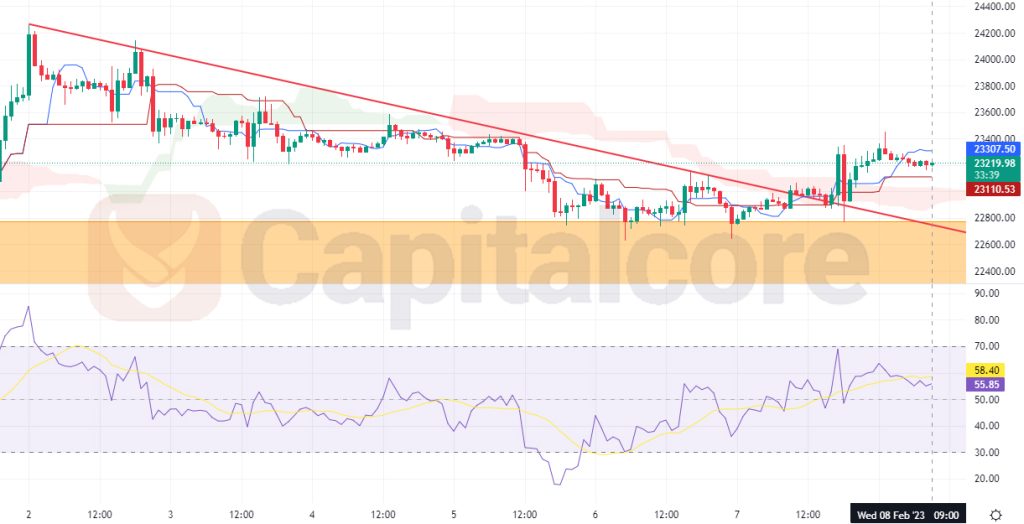
Chart Notes:
• Chart time-zone is UTC (+03:00)
• Candles’ time-frame is 1h.
The red line on the chart indicates the trend line, within which, the price line went through the last bearish leg. The yellow zone below the price line reflects the static demand zone; this zone has already been able to pump the price line several times before and is considered to include large amount of buy orders. As it can be seen on the chart, the price line could finally break above the bearish trend line on February the 7th, 2023. Meanwhile RSI has started an ascending trend and the price line broke above the Ichimoku cloud. Traders can expect a retest of the Ichimoku cloud, or the static support zone, there they can enter long positions; the target for the bullish wave could be considered on 23580 and 24150 after that.
• DISCLAIMER: Please note that the above analysis is not an investment suggestion by “Capitalcore Ltd”. This post has been published only for educational purposes.