Bearish signals on BTC price chart
BTC price chart started a sideway range after the price on this asset had gone through a sharp bearish rally. Currently, the price line stared a smooth bullish wave and could grow up to almost 24300; how ever bears managed to dump the price line once more to its dynamic support zone. Some bearish signals have been issued and another bearish wave looks potential.
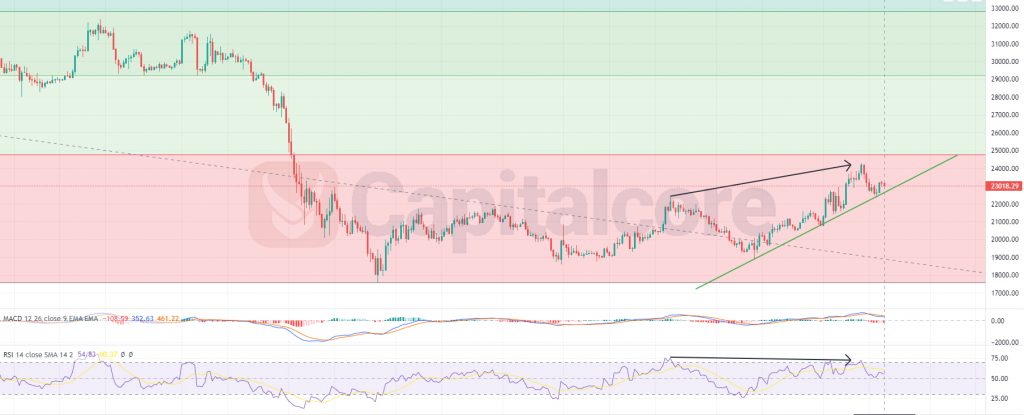
Chart Notes:
• Chart time-zone is UTC (+03:00)
• Candles’ time-frame is 4h.
The price line on BTC/USD price chart, is indicating 23018 at the moment; this area is located just below level 0.236 of the Fibonacci retracement and on the dynamic support line that has formed the current ascending leg. This resistance level is resembled as a green ascending line on the price chart. RSI is indicating almost 55 and is showing negative divergence, reflected by two black arrows on the price chart and RSI. MACD is showing bears strengthening again and another bearish wave looks highly potential. Sellers can be waiting for the price line to touch level 0.236 of the Fibonacci retracement, located at 24500 once more; when they can enter short positions heading to 18000 and 15000 after that. Traders with less risk appetite can be waiting for the price line to break below the green trend line, and on the retest of this area, they can enter short positions. Level 0.236 of the Fibonacci retracement, which lays at about 25000, can be considered as stop loss for traders.
• DISCLAIMER: Please note that the above analysis is not an investment suggestion by “Capitalcore Ltd”. This post has been published only for educational purposes.