The price on a narrow range of motion
Miner Reserve chart, is going through a strong descending wave, which reflects the fact that the supply of BTC coins, held by miners is decreasing; and taking the growth of wallet to exchange transfer rate into the consideration, it could be indicated that BTC holders are tending to sell their BTCs.
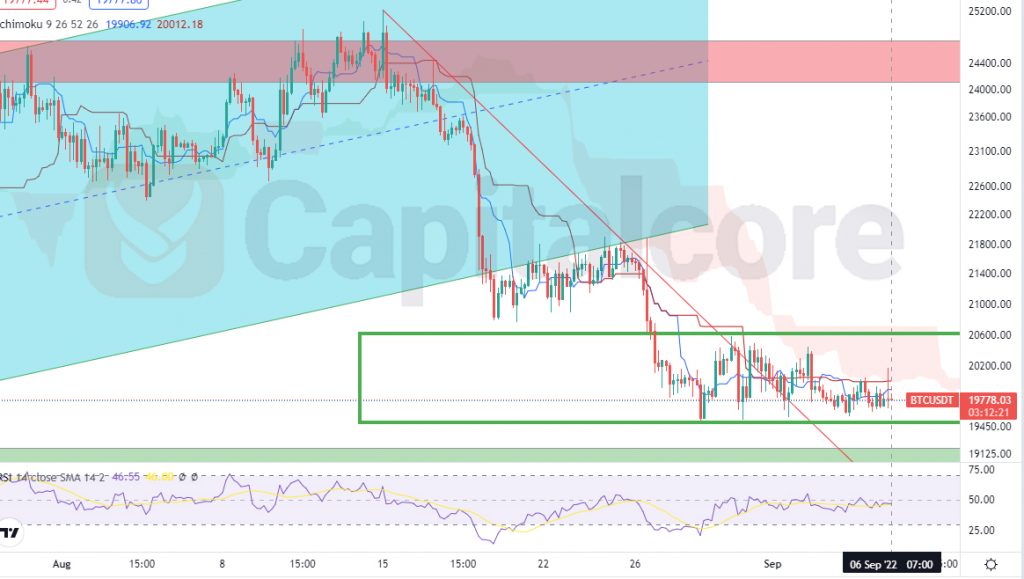
Chart Notes:
• Chart time-zone is UTC (+03:00)
• Candles’ time-frame is 4h.
On the BTC price chart, the price line has been moving within a narrow sideway range in the past few days, after the announcement of the unemployment rate specifically. The area within the rectangle is the ranging area, and as you can see the price motion has decreased significantly after falling to this area. The light blue channel is indicating a bullish channel which has been broken. RSI, on the other hand, is moving at about 50 and is indicating indecision in the market, however positive divergence has also been issued on the same indicator. Icimiku cloud is flattened above the price line and is expected to behave as a resistance level. The chance of descending is now strengthening on BTC chart and seller can expect a big loss, after the ranged area is broken to the down side.
• DISCLAIMER: Please note that the above analysis is not an investment suggestion by “Capitalcore Ltd”. This post has been published only for educational purposes.