BTC’s Momentum: Ichimoku and MACD Insights
Bitcoin has been exhibiting a strong performance as seen in the BTC/USD chart dated February 16, 2024. The cryptocurrency continues to attract attention from investors looking for volatility and growth potential in the digital currency space.
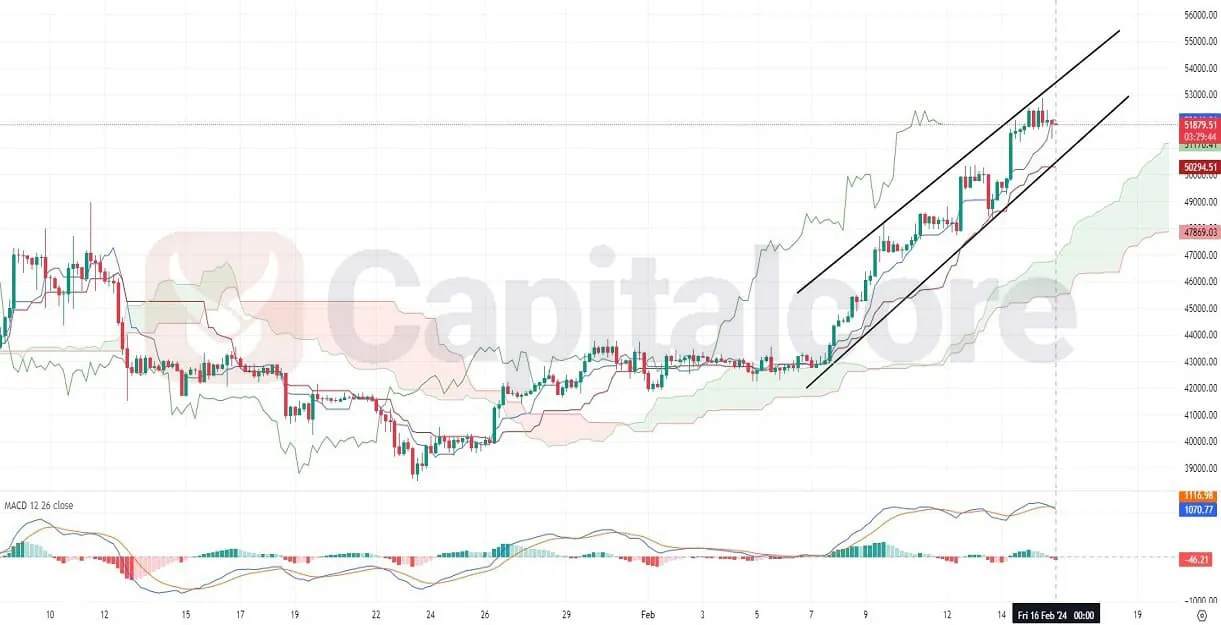
Chart Notes:
• Chart time-zone is UTC (+03:00)
• Candles’ time-frame is 4h.
The technical chart for BTC/USD shows a sustained uptrend within a well-defined ascending channel, highlighting a bullish sentiment among traders. The price is trading above the Ichimoku cloud, indicating a robust support zone that has maintained the upward momentum. The Moving Average Convergence Divergence (MACD) shows a bullish crossover, with the signal line below the MACD line, which traditionally suggests the potential for a continued rise. However, the Relative Strength Index (RSI) is hovering close to the 70 level, signaling that the asset is approaching overbought conditions and may face a potential pullback or consolidation in the near term. The support levels to watch are the lower boundary of the ascending channel and the top line of the Ichimoku cloud, whereas resistance is likely to form near the upper line of the ascending channel.
• DISCLAIMER: Please note that the above analysis is not an investment suggestion by “Capitalcore Ltd”. This post has been published only for educational purposes.