Correction Phase and Support Zone
UK100 has recently experienced a strong bullish wave that began on March 20th, 2023, and continued for about a month. However, after a sustained period of bullish momentum, the price line entered a correction phase, which drove the price line towards a support zone. Currently, the price line is reacting to this support zone, and there is a possibility of a bullish wave in the near future.
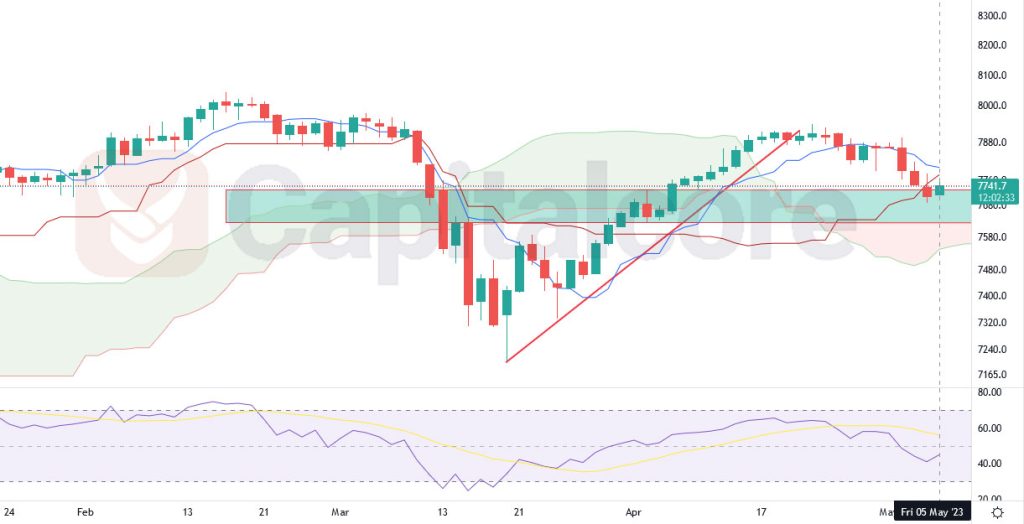
Chart Notes:
• Chart time-zone is UTC (+03:00)
• Candles’ time-frame is daily.
The recent bullish wave in UK100 that began in March 2023 was largely fueled by positive economic news and a sense of optimism in the market. However, as the price line entered into a correction phase, traders became cautious and started looking for signs of a potential reversal. The current reaction to the support zone suggests that the market is still optimistic about the prospects of UK100, and there is a possibility of a bullish wave in the near future. It is important for traders to keep an eye on the support zone, as it will likely play a crucial role in determining the future direction of the price line. Additionally, traders should be aware of any potential downside risks, such as a sudden change in market sentiment or an unexpected economic event, and have a solid risk management strategy in place. By monitoring the price action around the support zone and keeping a close eye on market developments, traders can make informed decisions and potentially capitalize on any bullish opportunities that arise.
• DISCLAIMER: Please note that the above analysis is not an investment suggestion by “Capitalcore Ltd”. This post has been published only for educational purposes.