GBP/USD Resistance Level Persists
The foreign exchange market can be a complex and volatile environment, where currency prices can fluctuate rapidly in response to global economic and political events. Traders need to stay up to date with market news and trends to make informed decisions about buying and selling currencies. In this context, let’s examine the current situation of GBPUSD.
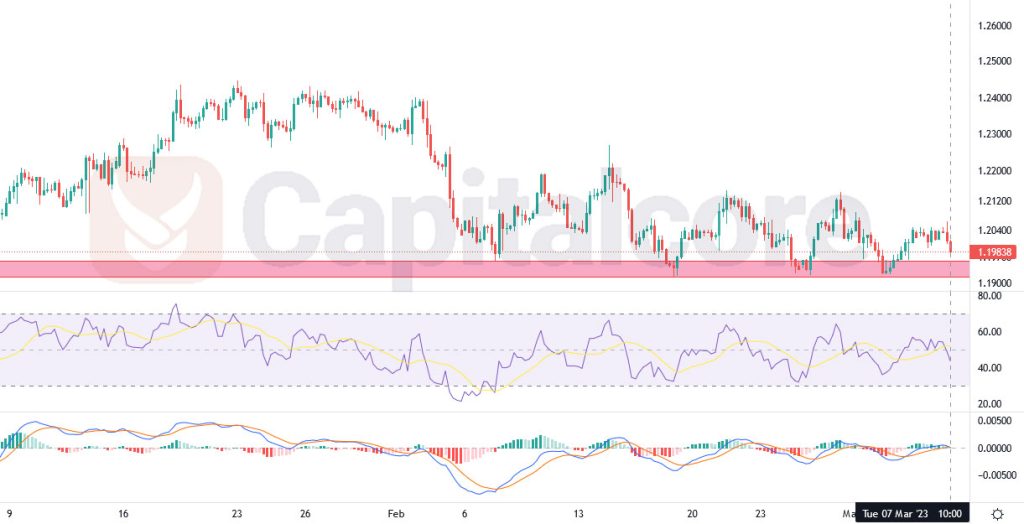
Chart Notes:
• Chart time-zone is UTC (+03:00)
• Candles’ time-frame is 4h.
The GBPUSD pair has been showing a prolonged resistance level represented by a red zone below the price line. Despite several attempts, the price line has not been able to break below this level, indicating strong support at that point. However, there are signs of the bullish power fading away as the price has been pumped weaker each time. Moreover, the Moving Average Convergence Divergence (MACD) indicator is showing potential for a descending wave. Given these indicators, it is likely that the price line will eventually break below the mentioned resistance, leading to a substantial loss for GBP against USD. Therefore, traders may want to monitor this situation closely and adjust their positions accordingly to minimize potential losses.
• DISCLAIMER: Please note that the above analysis is not an investment suggestion by “Capitalcore Ltd”. This post has been published only for educational purposes.