An ascending wave can be expected
The price line on GBPUSD price chart, had been moving within an ascending triangle; until 26th of October 2022, when the price on this pair could break above the top resistance of the triangle and some indicators have issued bullish signals; therefore a bullish trend can be expected shortly.
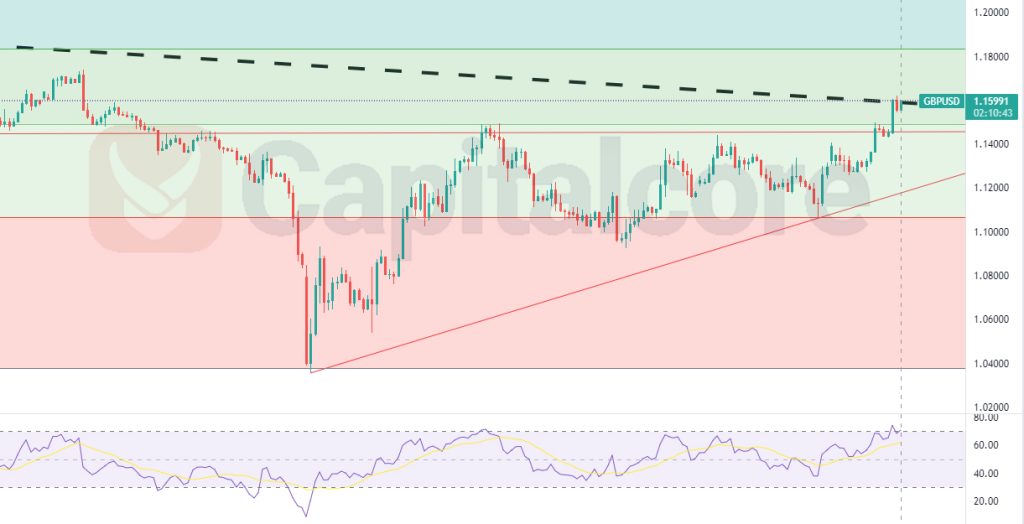
Chart Notes:
• Chart time-zone is UTC (+03:00)
• Candles’ time-frame is 4h.
The mentioned triangle pattern has been reflected with thin red lines on the chart above. The colorful horizontal levels are trend base Fibonacci levels that can be considered as important support and resistance levels. As it can be observed on the chart, the price line could break above 1.15000, and so above the resistance of the top line of the triangle on 26th of October. Meanwhile RSI is almost inside over buying area. A short ascending leg can occur shortly, heading to the top resistance of the triangle. There, Buyers can enter the market and expect an ascending wave, heading to 1.18340, which would be level 0.5 of the trend based Fibonacci extension. The other targets can be set on 1.17400 and 1.21788. Also consider that, in case the price line breaks below 1.13600, The ascending chance might be brought into question.
• DISCLAIMER: Please note that the above analysis is not an investment suggestion by “Capitalcore Ltd”. This post has been published only for educational purposes.