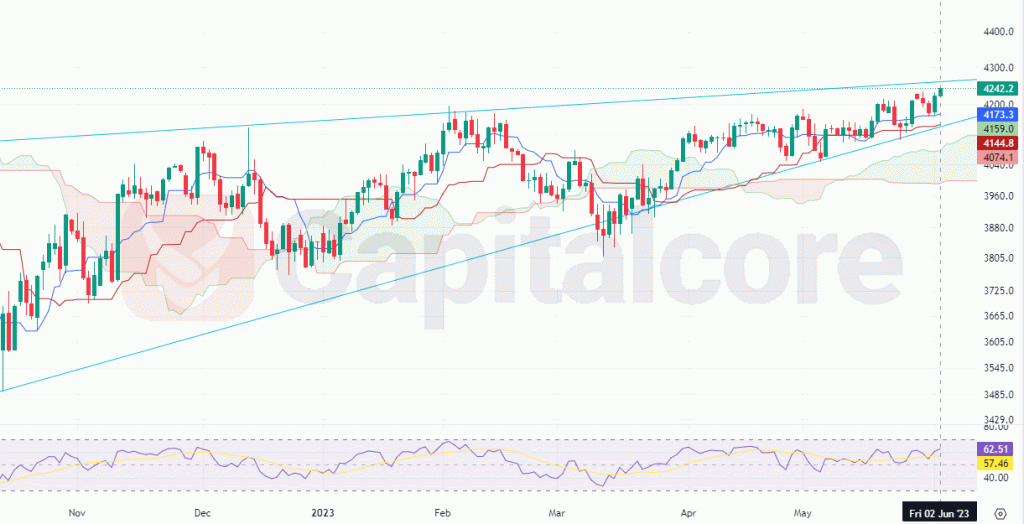
Ascending wedge pattern is formed
The US500, represented by the S&P 500 index, has recently experienced a significant bullish development as the price line broke above the Ichimoku cloud. This breakout is considered a strong buy signal, indicating a potential reversal in the trend from bearish to bullish. The Ichimoku cloud, consisting of multiple lines that provide support and resistance levels, is widely followed by traders to gauge market sentiment and trend direction. The breakout above the cloud suggests that the bulls have gained control and are likely to drive the price higher in the coming sessions.

Chart Notes:
• Chart time-zone is UTC (+03:00)
• Candles’ time-frame is 4h.
Furthermore, the price line has formed a rising wedge pattern, characterized by converging trendlines with higher lows and higher highs. This pattern typically represents a period of consolidation before a potential breakout or breakdown. Traders should pay attention to the potential retest of either the Ichimoku cloud or the base line of the wedge pattern. Such a retest often occurs after a breakout and can serve as a favorable entry point for long positions. If the price successfully retests and holds above these levels, it would confirm the strength of the bullish trend and provide an opportunity for traders to capitalize on the upward momentum. As with any trading strategy, it is important to consider additional technical indicators, monitor market conditions, and implement proper risk management techniques. Traders should closely monitor the price action and wait for confirmation signals before entering long positions based on the retest of the Ichimoku cloud or the base line of the wedge pattern. It is also advisable to set appropriate stop-loss levels to protect against potential downside risks.
• DISCLAIMER: Please note that the above analysis is not an investment suggestion by “Capitalcore Ltd”. This post has been published only for educational purposes.