Ichimoku Cloud Breakout in USDJPY
The USDJPY price has recently shown signs of a bullish trend, as it has started to move within a bullish channel. This suggests that there is strong buying pressure in the market and that investors are optimistic about the future direction of the currency pair. Furthermore, the Relative Strength Index (RSI) is on the neutral area, indicating that the price is not overbought or oversold. This suggests that there may still be room for further gains before the price reaches a point of resistance.
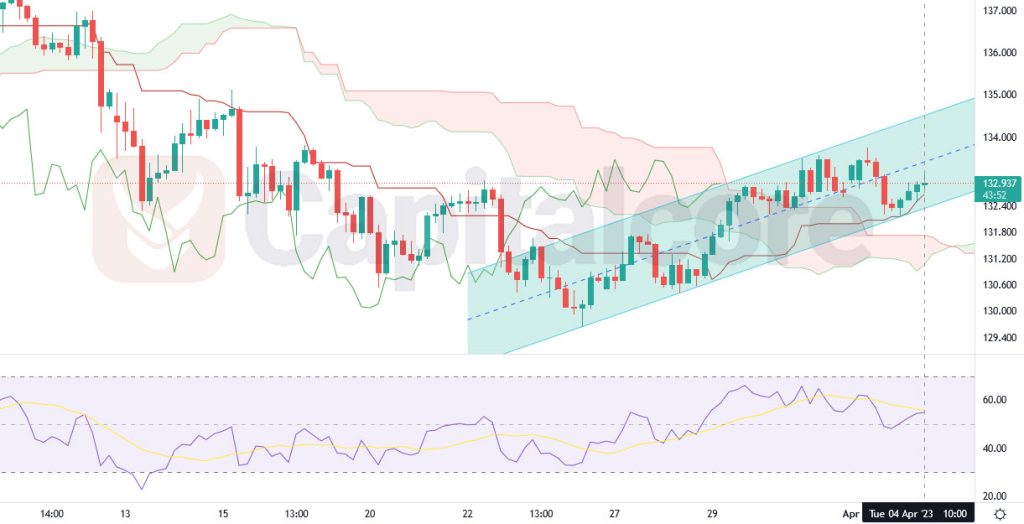
Chart Notes:
• Chart time-zone is UTC (+03:00)
• Candles’ time-frame is 4h.
Additionally, the price has recently broken above the Ichimoku cloud, which is a technical indicator that is used to identify potential levels of support and resistance. This suggests that the bullish trend may continue in the near future, as the price has broken through a key level of resistance. Traders may look for opportunities to buy the currency pair on pullbacks within the bullish channel or on other technical signals that suggest a continuation of the uptrend. Overall, the USDJPY price appears to be in a bullish trend, with strong buying pressure and positive technical indicators suggesting that the trend may continue in the near future. However, traders should always exercise caution and carefully manage their risk, as market conditions can change quickly and unexpected events can have a significant impact on currency prices.
• DISCLAIMER: Please note that the above analysis is not an investment suggestion by “Capitalcore Ltd”. This post has been published only for educational purposes.