The strong support level is broken
Housing Starts and Manufacturing Shipments will be released in Canada and for sure will manipulate Canadian Dollar. With a quick analyze of the chart we can predict the next possible move of the price. Here is a short review of what has happened to USD/CAD in past few days.
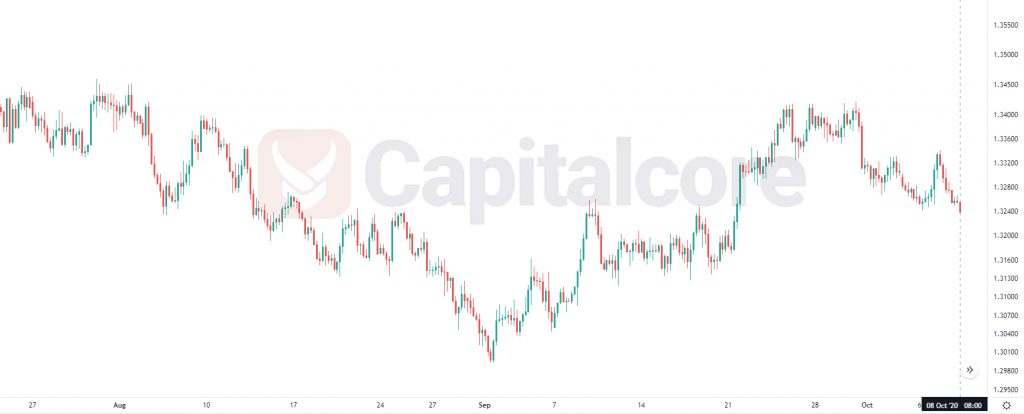
Chart Notes:
• Chart time-zone is UTC (+03:00)
• Candles’ time-frame is 4h.
The pair is finding support at 1.32000 with resistance at 1.32750 which both lines are above the weekly pivot point at 1.33250. The EMA of 10 is moving with bearish bias in the descendant channel and it is located below the EMA of 200 and the EMA of 100. The RSI is moving in oversold area, the MACD line is below the signal line in the negative territory and the Stochastic is moving in low ranges. The ADX is showing sell signal. The price is below the Ichimoku Cloud and the Chinkou Span. The Tenkan-sen and the Kijun-sen are both showing a downward trend.
Short positions are recommended towards 1.32000.
• DISCLAIMER: Please note that the above analysis is not an investment suggestion by “Capitalcore Ltd”. This post has been published only for educational purposes.