- November 26, 2021
- Category: Market News
The descending trend line is broken
EUR/USD price could finally break above the trend line that started forming on 9th of November 2021. The price line after touching level 0.236 of the Fibonacci retracement started descending. Buyers can be waiting for a retest of the broken trend line to enter the market.
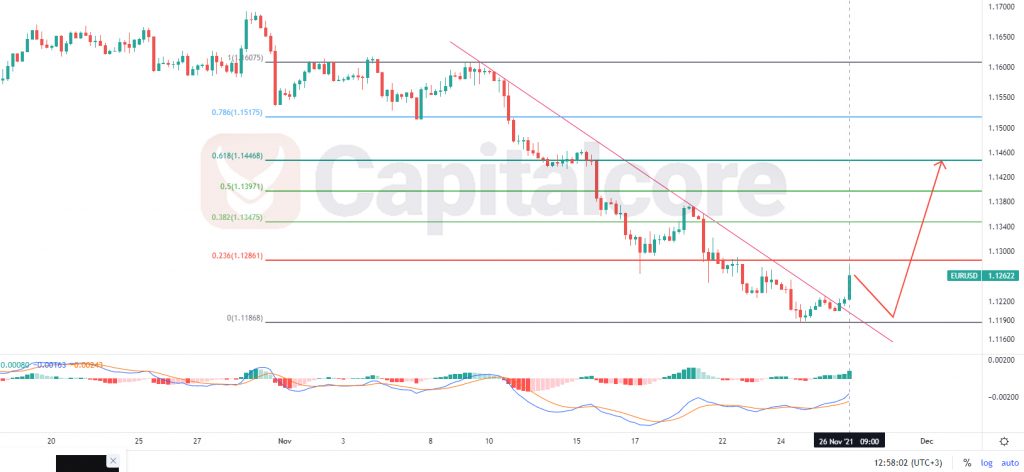
Chart Notes:
• Chart time-zone is UTC (+03:00)
• Candles’ time-frame is 4h.
the price is on 1.1262 at the moment and above the descending trend line. The closest resistance around the price line is on 1.1287 the the closest support level is on 1.119 . MACD is showing strong ascending trend and RSI has just broken above 50, showing 55 at the moment. The overall look of the chart is bullish, therefore buyers can wait for the price line to have a retest of the broken resistance shown in pink. The area between 1.12 – 1.119 would be a good entrance for buyers. Bulls can target any of the Fibonacci levels for their TP. Please consider that in case the price line breaks below 1.1183 the chance for ascend would decrease.
• DISCLAIMER: Please note that the above analysis is not an investment suggestion by “Capitalcore Ltd”. This post has been published only for educational purposes.