The bears seem to be tiring
GBP/NZD price line has long been going through a bearish market. The value of this pair is now on a valid support level. This level is expected to consist a big deal of demands and therefore can alter the trend.
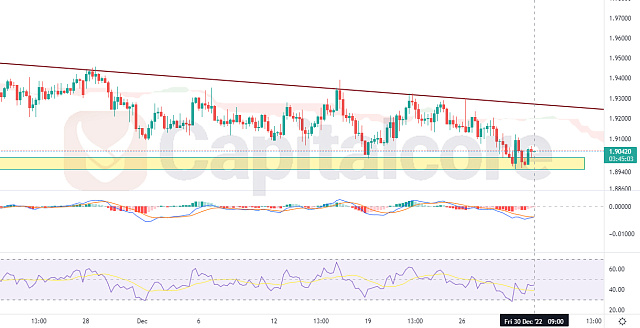
Chart Notes:
• Chart time-zone is UTC (+03:00)
• Candles’ time-frame is 4h.
Recently, the GBPNZD price line has been oscillating in a narrow band. On this chart, a static support line that is denoted as a light-yellow area beneath the price line formed during this neutral trend. The static resistance level that established above the price line is reflected in the falling dark red line above the price line. On the chart, MACD and RSI indicate that an ascending wave may soon form. After a possible retest of the support zone, traders can maintain a tight check on the chart to look for any ascending trigger. From there, they can enter long positions that will take them to the resistance levels at 1.92100 and 1.93000 .
• DISCLAIMER: Please note that the above analysis is not an investment suggestion by “Capitalcore Ltd”. This post has been published only for educational purposes.