The price line looks ready for a big descend
CAD/CFH has been ascending above a support line since 19th of March 2020. Despite making several attempts, the price line could not break below the dynamic support until 17th of December 2021. The price at the moment is below the support line and the overall look of the chart is bearish.
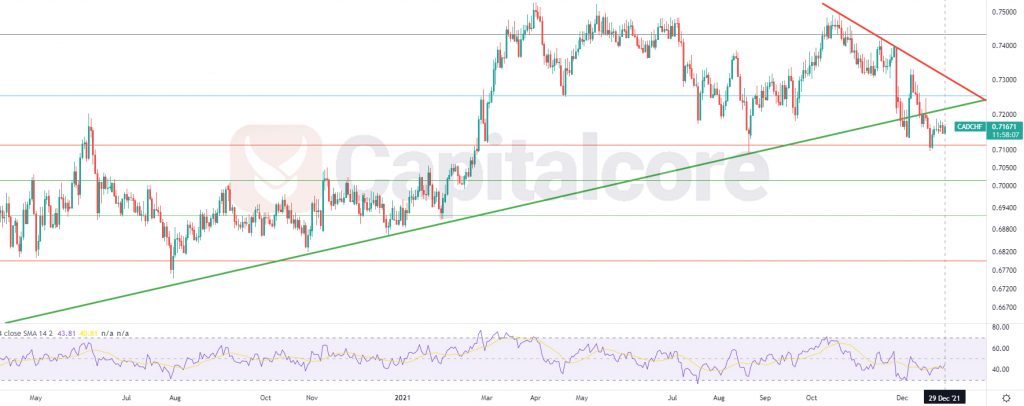
Chart Notes:
• Chart time-zone is UTC (+03:00)
• Candles’ time-frame is daily.
The price is on 0.71671 at the moment, which would be below the long term support level. The green line indicates the support level. The price is on a descending phase, started on 20th of October. The red line indicates the resistance level which has caused the descending wave. RSI is below 50 line, at about 45 and has recently broken above its SMA. The most important support level is considered 0.71234 which equals to level 0.618 of the Fibonacci retracement. In case the price price line breaks below this Fibonacci level, sellers can enter the market and target 0.7024 as their first target and 0.69234 as the next one. Please consider that breaking above the green line on the picture, at any moment, would reduce the chance of descent largely.
• DISCLAIMER: Please note that the above analysis is not an investment suggestion by “Capitalcore Ltd”. This post has been published only for educational purposes.