The top line of the channel is broken
CAD/CHF felt into an ascending channel on 3rd of February 2022 and then ascended up to almost 8% until 13th of May 2022 when the top line of the channel was broken. The price line at the moment is having a retest of the top line of the channel and the next ascending wave might occur shortly.
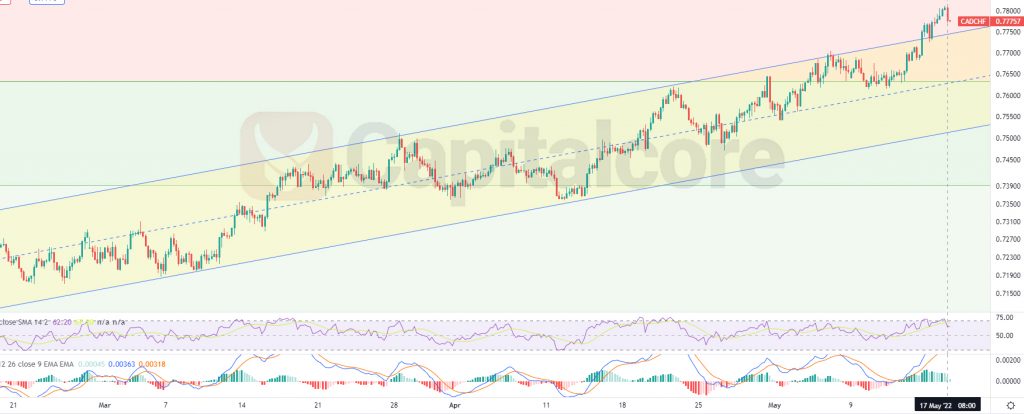
Chart Notes:
• Chart time-zone is UTC (+03:00)
• Candles’ time-frame is 4h.
The price line at the moment is showing 0.77757, which would be just above the top line of the ascending channel and between level 0.5 and 0.618 of the Fibonacci retracement on the previous major descending wave. The yellow zone on the chart indicates the ascending channel, as you can see on the chart, this channel is not valid anymore, as the price line has broken above it. RSI is not yet inside overbuying zone and MACD is showing weak ascending wave on going. Traders can be waiting for the price line to have a retest of the top line of the channel and then they can enter long positions. The target for the ascending wave could be considered on 0.8 and 0.823 after that.
Please note that, in case the price line break below the midline of the channel, the chance would be mostly with bears than bulls.
• DISCLAIMER: Please note that the above analysis is not an investment suggestion by “Capitalcore Ltd”. This post has been published only for educational purposes.