Bullish power is about to end
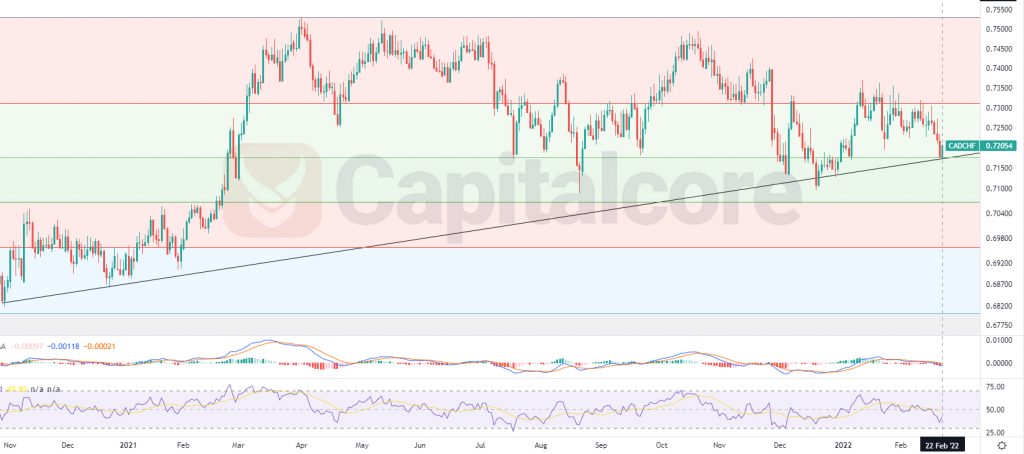
CAD/CHF started an upward trend on 29th of October, 2020 and could ascend almost 10.5 % until 31th of March 2021 and then The price started a sideway trend. The bullish trend formed a dynamic support line while moving upward trend. The price is once more on the trend line at the moment and The next move would be of high importance.

Chart Notes:
• Chart time-zone is UTC (+03:00)
• Candles’ time-frame is daily.
The black ascending line on the chart illustrates the bullish trend line that started forming on 29th of October. The price is on 0.72054 at the moment, which would be just above the dynamic trend line as well as level 0.382 of the Fibonacci retracement. MACD is showing weak bearish trend and RSI is almost on 40. Traders can be waiting for the price line to break below the dynamic trend line and then on the retest of the broken trend line, there they can enter short positions. The possible targets for the descending trend can be 0.695 and 0.6867. Please consider that, in case the price line breaks into the red zone, the chance of the descending trend to occur, would reduce.
• DISCLAIMER: Please note that the above analysis is not an investment suggestion by “Capitalcore Ltd”. This post has been published only for educational purposes.