The next ascending leg seems close
CAD has been empowered against CHF in the past days. On the price chart the price line could break above the dynamic resistance, about four days ago. Currently, after a retest of the broken dynamic resistance, the price moved upward. The overall look of the chart is currently bullish.
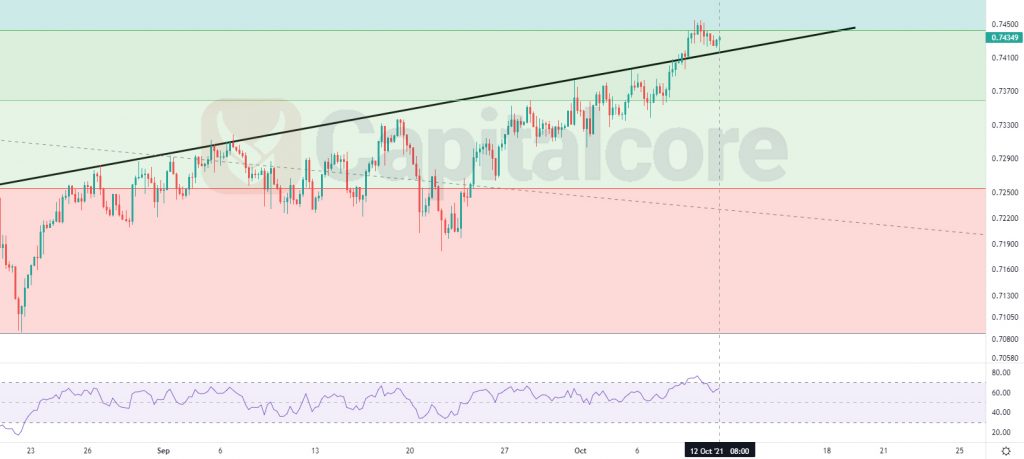
Chart Notes:
• Chart time-zone is UTC (+03:00)
• Candles’ time-frame is 4h.
There is a strong resistance on 0.7455. If the price can break above this area we can expect a strong bullish step to come. The area could push the price down several times in the past and also equals to 0.5 of the Fibonacci retracement. In case the price can break above this area, the next resistance to which we expect the price to reach is at 0.75. The second TP for buyers can be0.7527. On the other hand if the price breaks below the dynamic support, Sellers can step in. The first target of the descending wave could be 0.736 and if the descending wave passes this area, the next target can be 0.7311. The next few candles are absolutely important, keep your eyes on the chart.
• DISCLAIMER: Please note that the above analysis is not an investment suggestion by “Capitalcore Ltd”. This post has been published only for educational purposes.