The price line, inside a wedge pattern
CAD/JPY price line, started an ascending wave on 18th of March 2020. The price ascended about 26% until 21st of October 2021. Since then a descending wave started forming and the price on this pair started a correction phase. At the moment, the price is on a critical spot and the next move would be of high value.
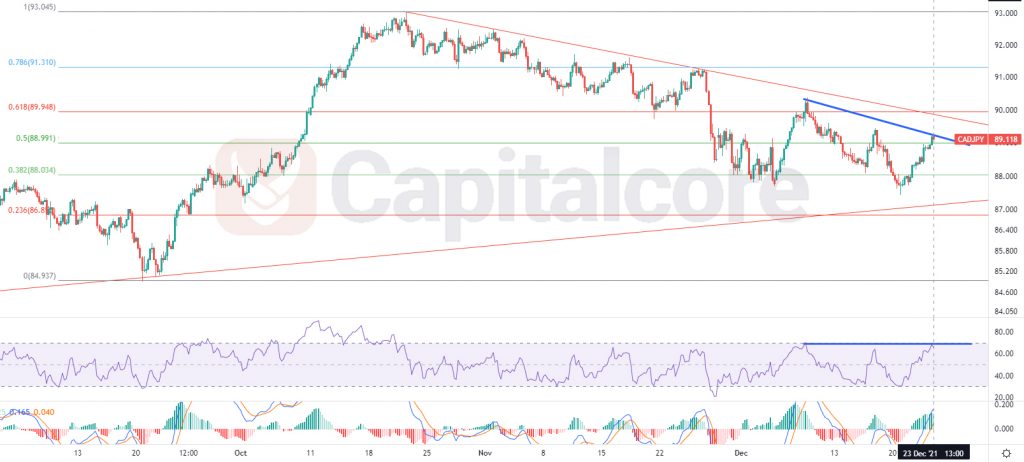
Chart Notes:
• Chart time-zone is UTC (+03:00)
• Candles’ time-frame is 4h.
There is a dynamic resistance above the price line, colored in red, the long term dynamic dynamic support level also in red is visible below the price line. The price at the moment is on 89.118 which would be just above level 0.5 of the Fibonacci retracement. RSI is almost on 70 and is showing negative divergence, indicated with blue lines on the price chart and RSI indicator. MACD is showing a strong ascending wave on going. Buyers can be waiting for the price line to have a retest oh level 0.5 of the Fibonacci retracement and then they can enter the market. the targets for the wave would be 89.95 and 91.17. Please consider that in case the price line breaks below level 0.50, the chance for ascend would decrees largely.
• DISCLAIMER: Please note that the above analysis is not an investment suggestion by “Capitalcore Ltd”. This post has been published only for educational purposes.