- February 15, 2022
- Category: Market News
The price line in a wedge pattern
CAD/JPY has been moving above an ascending trendline since 18th of March 2020 and could ascend more than 25% until 21st of October 2021; The price then started a bearish trend and formed a wedge pattern. The next few candles are of high importance.
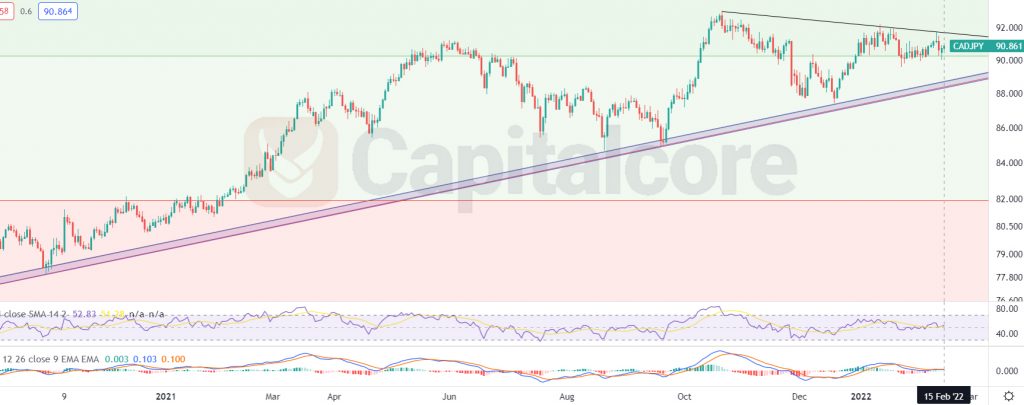
Chart Notes:
• Chart time-zone is UTC (+03:00)
• Candles’ time-frame is daily.
On CAD/JPY price chart, the price line at the moment is showing 90.861 which would be just above level 0.382 of the Fibonacci retracement. The purple area below the price line indicates the dynamic support level; this level started forming on 18th of March 2020 and is high importance. The blackline indicates the resistance level that has recently been formed. RSI is showing almost 53 and MACD is showing a weak ascending trend on going. Traders can be waiting for the price line to break through any of the support or resistance level and then they can enter the position. The targets for the descending wave could be considered on 82 and 78.15. The ascending wave on the other hand may reach out to 97 and 99.8.
• DISCLAIMER: Please note that the above analysis is not an investment suggestion by “Capitalcore Ltd”. This post has been published only for educational purposes.