Descending trendline is broken
CAD/JPY, scored a new ATH on 5th of November 2007 and then started a descending wave and formed new valleys and climaxes. Connecting these climaxes to each other, a descending trendline forms. The price line broke above this trendline on 12th of October 2021 and now is having a second retest.
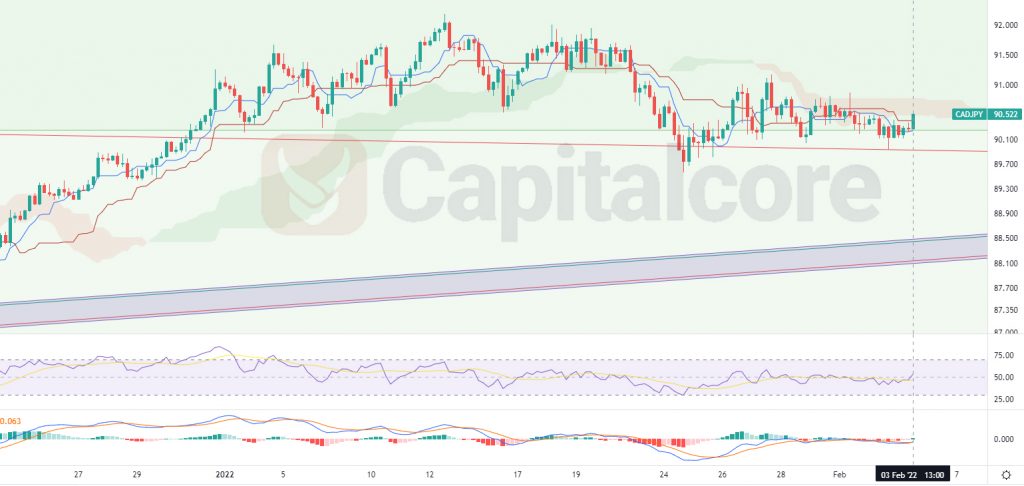
Chart Notes:
• Chart time-zone is UTC (+03:00)
• Candles’ time-frame is 4h.
CAD/JPY price is now on 90.522 which would be just above the strong descending trendline. The red line below the price indicates the trendline that started forming on 2007. The purple area below the price line indicates the dynamic support that started forming on 18th of March 2020. Bears have Ichimoku cloud to break through before forming an ascending phase. RSI is showing 53 and has lately broken above 50. MACD is showing the commencement of an ascending wave. There are two theories, potential of happening; if the price line can break above the Icimoku cloud, Traders can enter long positions, heading to 97.06 and 103.77 after that. The other possible theory is, forming a temporary descending wave that heads to the purple area and then a bullish trend can start forming; the targets would be same. Please consider that in case the price line breaks below the purple zone, the chance for ascend would highly reduce.
• DISCLAIMER: Please note that the above analysis is not an investment suggestion by “Capitalcore Ltd”. This post has been published only for educational purposes.