The ascending trendline is broken
CAD/JPY started an ascending wave on 20th of December and could ascend up to 5.4% until 12th of January. On 12th of January the price line finally broke below the ascending trendline and at the moment the price line is making a pullback to the broken trendline.
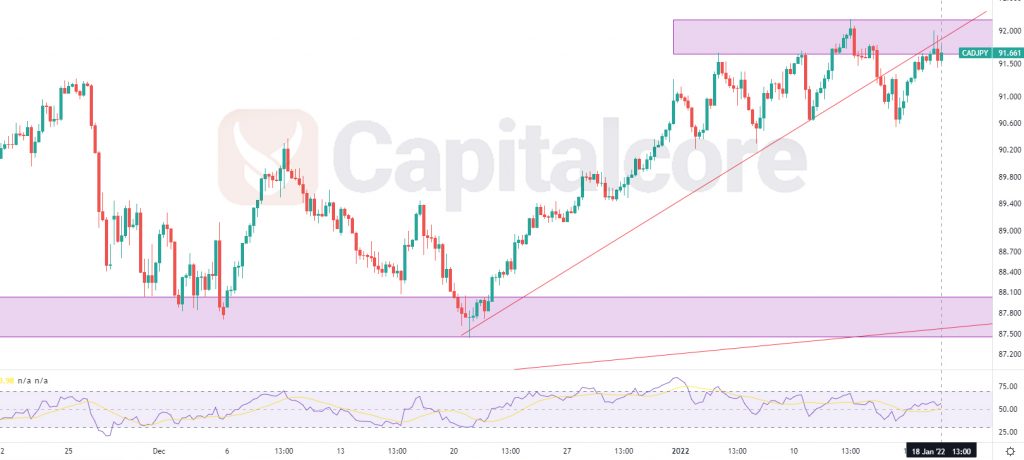
Chart Notes:
• Chart time-zone is UTC (+03:00)
• Candles’ time-frame is 4h.
The price line at the moment is on 91.66. There is a resistance level on 91.64 – 92.165, which has been shown as a purple area on the chart. The red line on the chart indicates the broken trendline and as it is shown on the chart, a retest is happening at the moment. RSI is on 56 and is showing negative divergence. The overall look of the chart is bearish and it looks as if the ascending trend is coming to an end. Sellers can be expecting to see the price on 90.595 shortly; the next targets for the descending wave could be considered on 88.135 and 87.5 . Please consider that breaking above 92.3 would highly reduce the chance of price reduction.
• DISCLAIMER: Please note that the above analysis is not an investment suggestion by “Capitalcore Ltd”. This post has been published only for educational purposes.