Understanding the Sideways Shift and Momentum Factors
CADCHF’s recent price action reveals a pronounced shift from a sharp decline to a sideways movement, prompting traders to decipher its implications. The subsequent analysis delves into the extended period of lateral consolidation, the proximity of the histogram to zero, and the stable Bollinger bands, shedding light on the intricate dynamics of this currency pair.
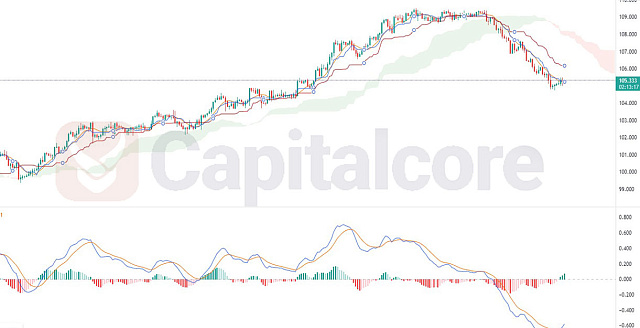
Chart Notes:
• Chart time-zone is UTC (+03:00)
• Candles’ time-frame is 4h.
CADCHF has witnessed a distinct price trajectory, shifting from a sharp decline to a sideways movement. This lateral consolidation phase, spanning approximately a month, reflects a market in search of direction following the previous price drop. The histogram’s proximity to zero underscores the balance between buying and selling pressures, indicating a lack of clear momentum. The constricting Bollinger bands suggest reduced volatility, with a consistent separation distance. While the trend is sideways, traders should be cautious, as this can precede significant price movements. Vigilance and multidimensional analysis, considering factors beyond technical indicators, are crucial for navigating the complexities of this current CADCHF market situation.
• DISCLAIMER: Please note that the above analysis is not an investment suggestion by “Capitalcore Ltd”. This post has been published only for educational purposes.