- April 5, 2023
- Category: Market News
Negative RSI Divergence Signal
The USDZAR price has been showing a bearish trend with some fluctuations in the recent past. However, the price has reacted to a support level indicated as a red area, leading to a bullish leg formation on the chart.
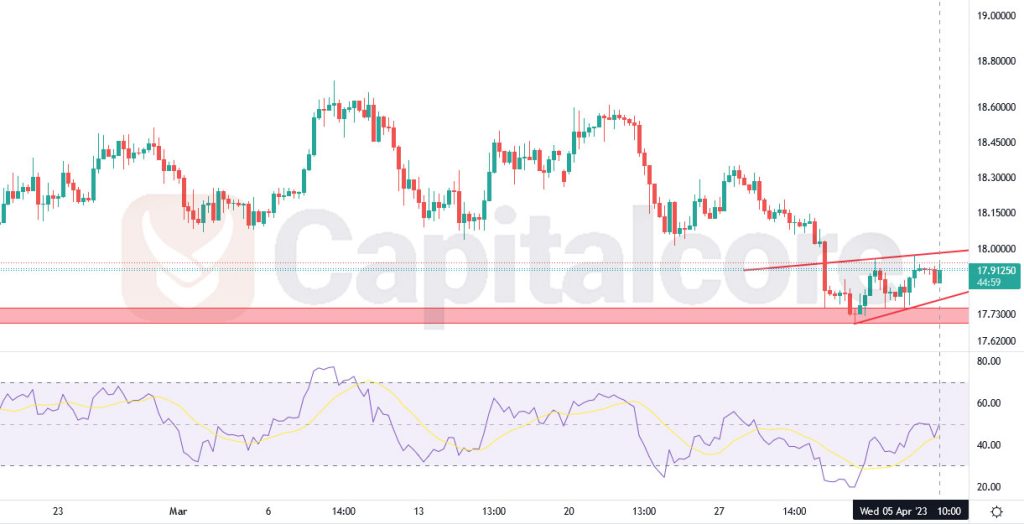
Chart Notes:
• Chart time-zone is UTC (+03:00)
• Candles’ time-frame is 4h.
The bearish trend can be seen in the downward slope of the price line. This suggests that the market has been dominated by sellers, and the demand for the US dollar against the South African rand has been decreasing. The fluctuations in the price line indicate that there have been periods of temporary price increases, but the overall trend has been downwards. The bullish leg formation indicates a potential shift in the market sentiment, with buyers starting to dominate the market. The support level, which is indicated as a red area, has acted as a price floor and has prevented the price from dropping further. This has attracted buyers, who have pushed the price up, resulting in a bullish leg formation. However, the bullish power does not seem to be strong, as the RSI (Relative Strength Index) is issuing a negative divergence signal. This means that the momentum of the bullish leg is not as strong as it should be, and the price may soon start to reverse back to the bearish trend.
• DISCLAIMER: Please note that the above analysis is not an investment suggestion by “Capitalcore Ltd”. This post has been published only for educational purposes.