The next descending wave looks close
After the release of Customer Confidence Rate, on 02 Aug ‘2022 the price line on CHF/JPY price chart, went through a sharp bullish wave and could ascend to almost 1.75% so far. The price line is now approaching to level 0.236 of the Fibonacci retracement on the previous major ascending wave and there is a high probability for the price line to enter a bearish wave.
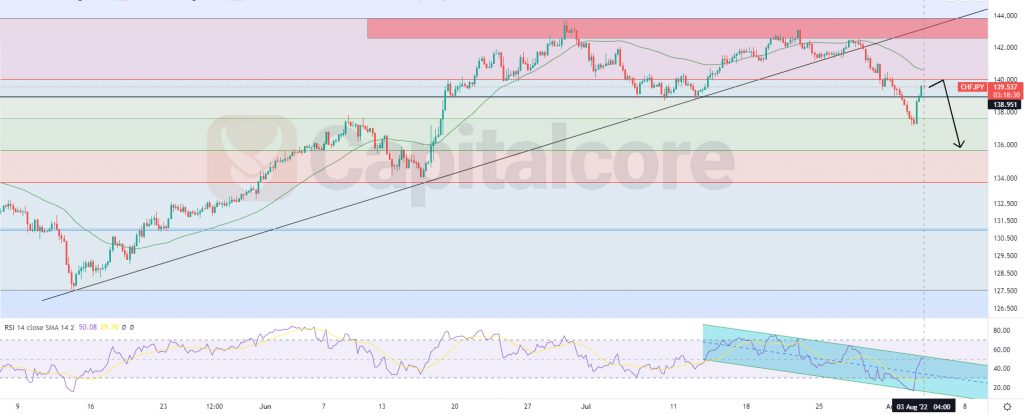
Chart Notes:
• Chart time-zone is UTC (+03:00)
• Candles’ time-frame is 4h.
The price line on CHF/JPY price chart is currently indicating 139.537 at this moment. The horizontal red line just above the price line indicates level 0.236 of the Fibonacci retracement. The current position of the price line is located just inside a resistance level; meanwhile the Relative Strength index (RSI) is moving within a bearish channel. RSI line is currently approaching to the top line of this channel and is expected to enter a bearish phase after touching that. Bulls should keep an eye on the price line to capture any bearish signal being issued; then they can enter short positions heading to 137.3 and 135.72 . Bears should also keep in mind that just as long as the price line does not break above level 0.236 of the Fibonacci retracement, the market theirs.
• DISCLAIMER: Please note that the above analysis is not an investment suggestion by “Capitalcore Ltd”. This post has been published only for educational purposes.