The price line is moving towards a strong resistance
CHF/JPY has been moving within an ascending channel since mid August 2019. The price line could ascend about 19% since the commencement of the bullish wave. The price line touched the top of the channel on 4th of January 2022 and then descended to the midline. The price right now is once more moving towards the top line.
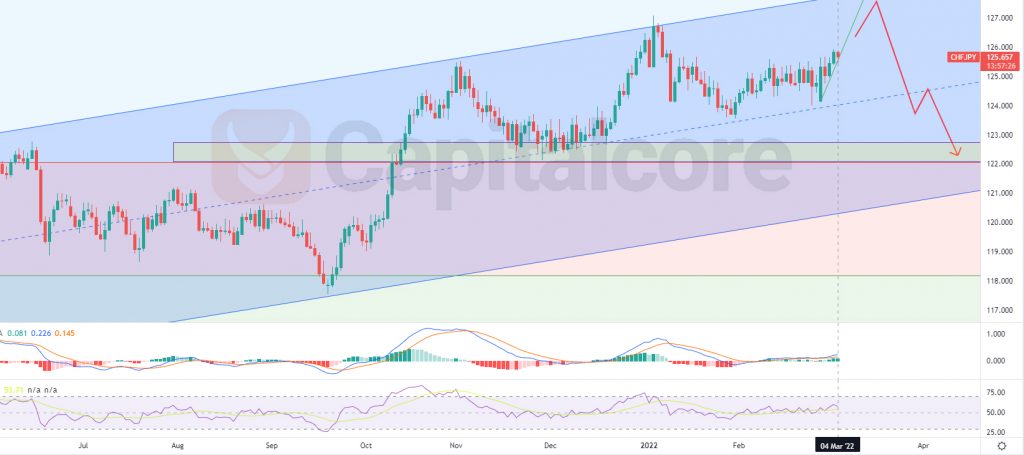
Chart Notes:
• Chart time-zone is UTC (+03:00)
• Candles’ time-frame is daily.
The price line on CHF/JPY at the moment is on 125.657. There is a resistance level on the current price which is not considered a very strong one. RSI is almost on 57 and there is a support level on 42 for RSI. MACD is showing a weak ascending trend which is getting smoothly more powerful lately. The yellow box on the chart indicates a static support zone. Above the price line, there is a resistance level at about 127.11 – 127.62; this area is considered a strong resistance as it equals to level 0.786 of the Fibonacci retracement as well as top line of the ascending channel. In case the price line can reach out to the topline, traders can enter short positions after they witness any ascending signals on smaller time frames. The target for the descending wave could be mid or base line of the channel. Please consider that this theory would be of value, just in case that the price line can reach out to the top level during the current ascending wave.
• DISCLAIMER: Please note that the above analysis is not an investment suggestion by “Capitalcore Ltd”. This post has been published only for educational purposes.