USD/CHF, ready for the next leg
The price on USD/CHF chart has been moving within an ascending channel for a long while. The price line has made several reactions to the top, mid and base line of the chart. A the moment the price line is once more pretty close to the mid line of the chart and keeping an eye on that would be a good idea!
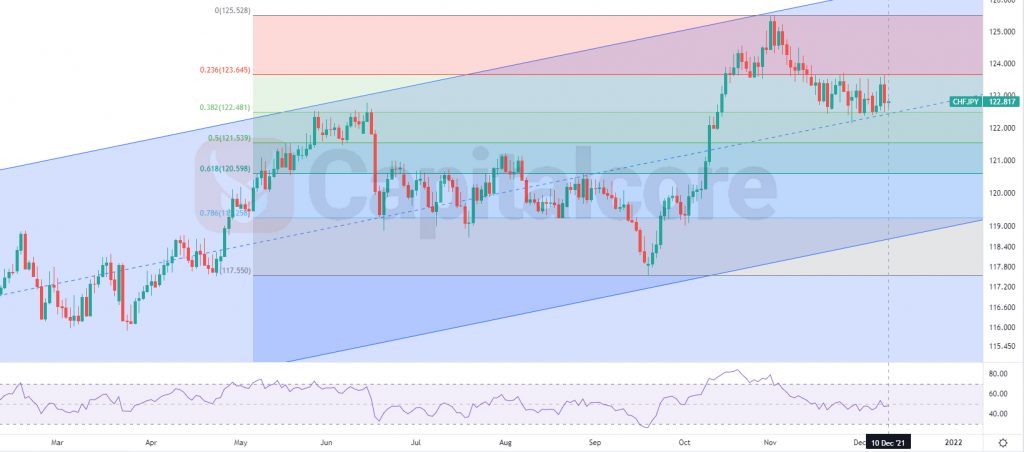
Chart Notes:
• Chart time-zone is UTC (+03:00)
• Candles’ time-frame is daily.
The price at the moment is on 122.817 which is almost in the mid line of the channel as well as level 0.382 of the Fibonacci retracement. MACD indicates the possibility of an ascend. The closest support level, to the price, lays on 123.65; the price line has made several reactions to this area. The area also equals to level 0.236 of the Fibonacci retracement and therefore is considered as an important resistance. The important support level below the price, lays at 122.32. RSI is almost on 50 and neutral. In case the price line breaks above the resistance level, possible targets for the ascending wave could be considered 124.555 and 125.422. On the other hand, in case the price line breaks below the support level, the ascending leg could reach to 121.54 and 120.588 .
• DISCLAIMER: Please note that the above analysis is not an investment suggestion by “Capitalcore Ltd”. This post has been published only for educational purposes.