- Posted By: capadmin
- Category: Market News
Ascending Triangle Formation
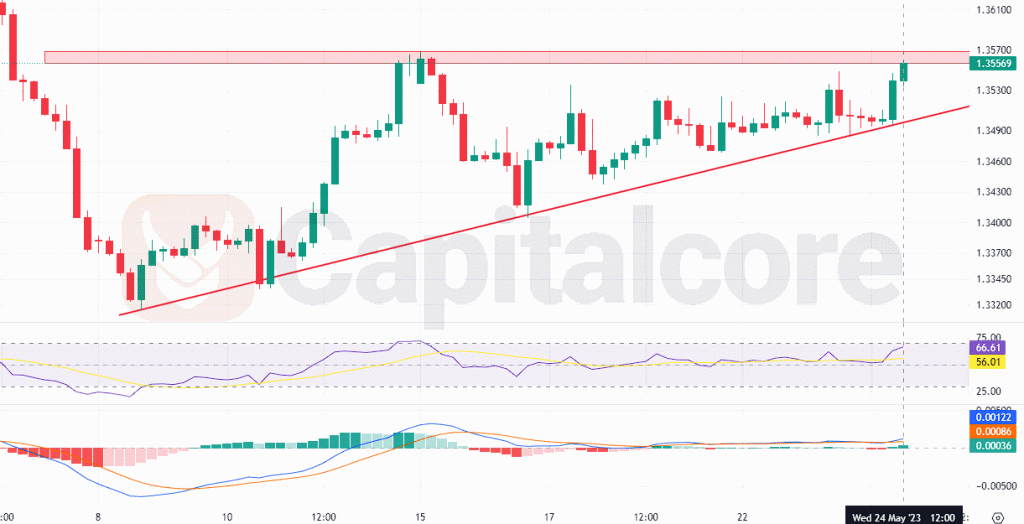
The USDCAD currency pair has been exhibiting a fascinating pattern on its price chart, specifically within an ascending triangle formation. Currently, the price line finds itself within a critical juncture, encountering a strong resistance zone along the top line of this triangle. This resistance acts as a barrier preventing further upward movement.

Chart Notes:
• Chart time-zone is UTC (+03:00)
• Candles’ time-frame is 4h.
Should the price line successfully break above this resistance level, it would present a favorable opportunity for bullish traders to enter positions, as it would signify a potential bullish breakout from the ascending triangle pattern. On the other hand, bears are advised to exercise caution and wait for the price line to break below the dynamic support line at the bottom of the triangle. If the price line breaches this support level, it would indicate a breakdown of the ascending triangle pattern and suggest a shift in market sentiment. At that point, bears could consider entering short positions, taking advantage of the potential downward momentum. By monitoring the price action within the ascending triangle and paying close attention to the breakout or breakdown of key levels, traders can make informed decisions to capitalize on potential market opportunities in the USDCAD currency pair.
• DISCLAIMER: Please note that the above analysis is not an investment suggestion by “Capitalcore Ltd”. This post has been published only for educational purposes.