The price is approaching a strong support zone
Since the 10th of November 2020, the EUR/NZD has been stuck in a trading range. Since then, the price has been bouncing between a support and a resistance zone. Following the EUR’s recent strength drop, EUR/NZD is once again approaching the support zone. The general appearance of the chart is still negative, but under specific conditions, a bullish phase might occur in the next few days.
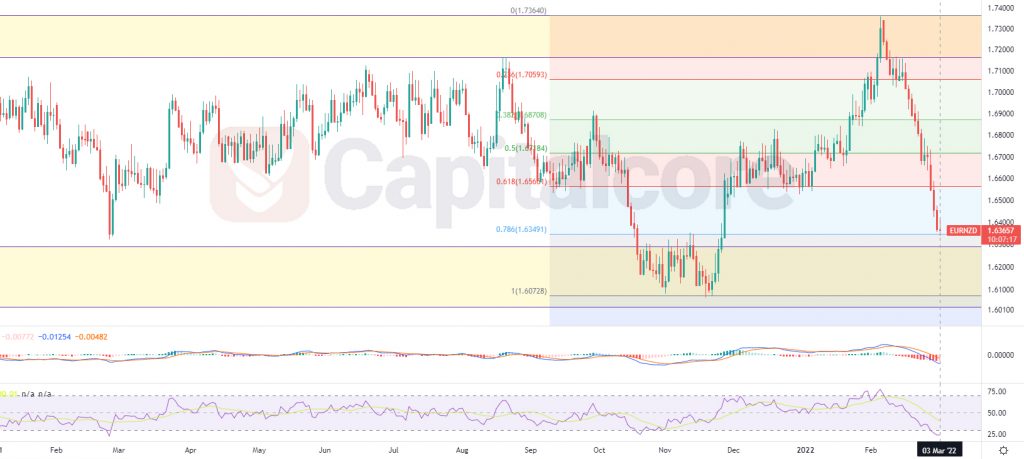
Chart Notes:
• Chart time-zone is UTC (+03:00)
• Candles’ time-frame is 4h.
EUR/NZD price at the moment is on 1.63657 and is getting close to the support zone on 1.602 – 1.6297; The yellow zone below the price line is showing this support zone. The other yellow zone above the price line is indicating the resistance zone which is placed on 1.71636 – 1.7364. RSI is in oversold zone and is also showing positive divergence. MACD is showing strong Bearish trend on going. Traders can be waiting for the price line to reach out to the support zone and in case they witnessed any bullish signals, they can enter long positions heading to the resistance level.
The opposite thing can also be profitable; traders can open sell positions on the resistance level if they received any bearish signals. This strategy could be profitable as long as both the support and the resistance zone are valid.
• DISCLAIMER: Please note that the above analysis is not an investment suggestion by “Capitalcore Ltd”. This post has been published only for educational purposes.