Bearish signals are visible on the chart
USD/CHF price, started a strong bullish trend on August 11th, 17:00. The price line on this pair, ascended to 3.05% until 22nd of August, at 18:00; when the bullish power started reducing and the ascending slope of the chart decreased. The price line is on a strong resistance level and the Elliott wave 5 seems to be reaching to its end.
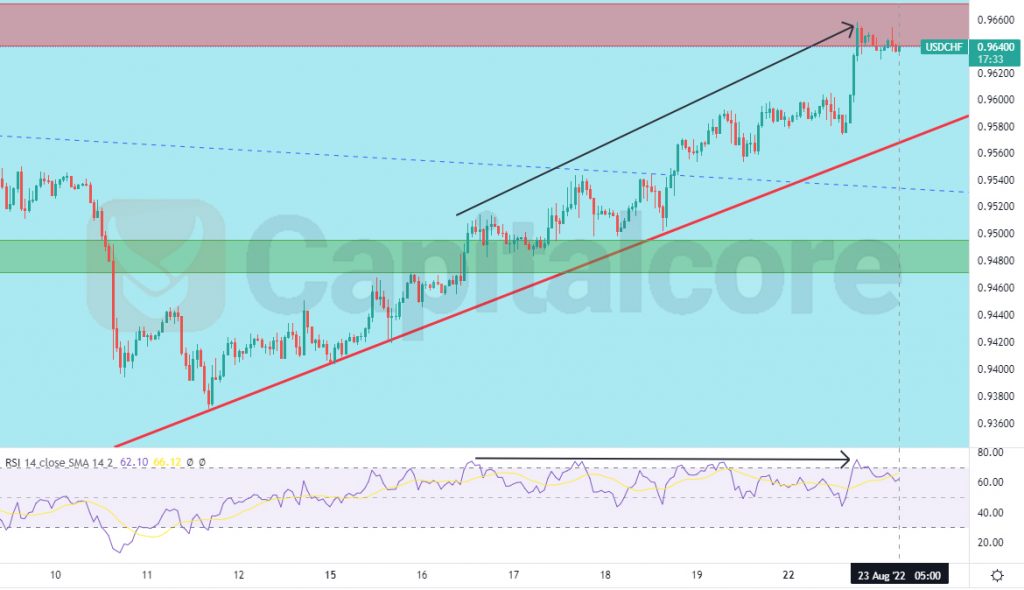
Chart Notes:
• Chart time-zone is UTC (+03:00)
• Candles’ time-frame is 1h.
The price line is currently showing 0.96400, which would be located just below a strong resistance zone; this zone is indicated as a red area above the price line. The red ascending line reflects the trend line which has formed the current ascending wave. As you can see on the chart, the price line has currently gone through a couple of dramatically ascending legs, and RSI has issued a multiple negative divergence signals; these can indicate the Elliott wave 5 is currently taking place and a sharp bearish wave can be expected shortly, as the bullish power seems to be reducing. Traders can enter short position on the next touch of the red resistance zone by the price line. The target for the bearish wave could be considered on 0.949 and 0.939.
Traders with less risk apatite, can be waiting for the price line to break below the red trend line, then they can enter short positions, heading to the mentioned support zones.
Please note that, in case the price line breaks above the light red zone, indicated on the chart, the chance would be more with bulls than the bears.
• DISCLAIMER: Please note that the above analysis is not an investment suggestion by “Capitalcore Ltd”. This post has been published only for educational purposes.