AUD/USD, on a strong resistance zone
As USD started gaining power in the previous month, AUD/USD price chart went through a sharp descending wave. The price line is now approaching a strong demand zone and a trend reversal looks highly potential on the chart.
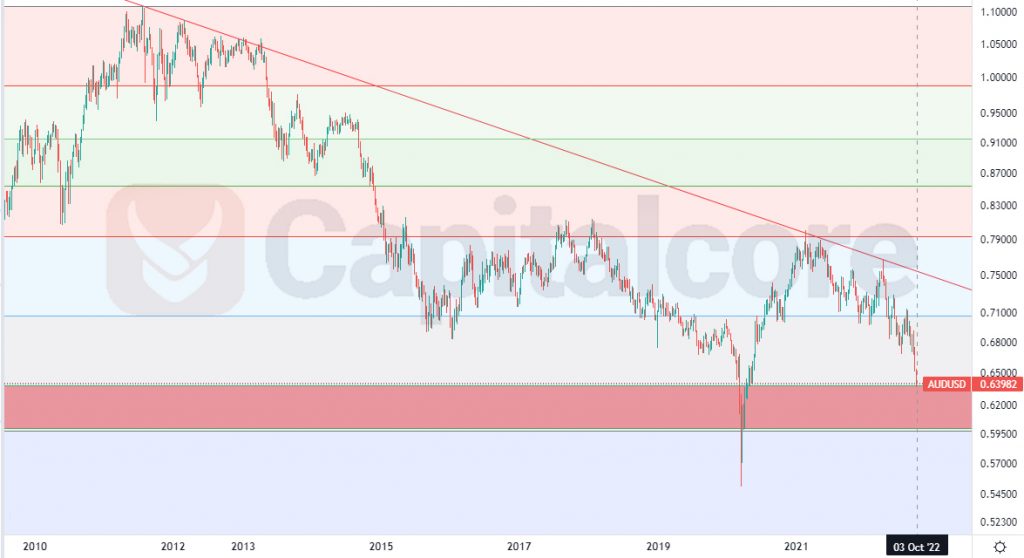
Chart Notes:
• Chart time-zone is UTC (+03:00)
• Candles’ time-frame is weekly.
On AUD/USD price chart, the price line froze on 0.63982 when the Forex market was closed. The price line is now just above the strong resistance which is reflected as a red zone below the price line on the chart. This area is considered important for bulls as it was already able to pump the price line several times in the past. The horizontal levels indicate the Fibonacci levels on the previous ascending wave. The red supply level also equals to level 0.786 of the Fibonacci retracement. It could be concluded that a trend reversal is now highly potential. The demand level is of wide thickness and therefore the price line might sink a little deeper inside it, before trend reversal occurs. The next monthly candle can be a green one.
• DISCLAIMER: Please note that the above analysis is not an investment suggestion by “Capitalcore Ltd”. This post has been published only for educational purposes.