- November 14, 2022
- Category: Market News
GBP/JPY at the top of the channel
GBP/JPY started a bearish trend on late October 2022; the formation of a bearish channel on the chart, was the outcome of the downtrend. The price line is now within the upper half the bearish channel and different bearish signals have been issued. Sellers should keep a keen eye on the chart to detect any bearish trigger.
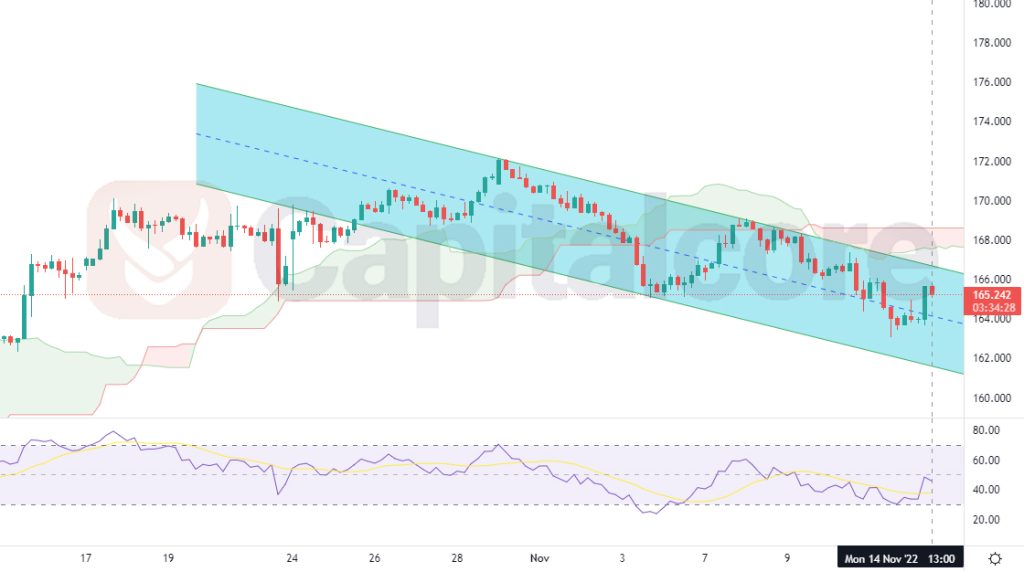
Chart Notes:
• Chart time-zone is UTC (+03:00)
• Candles’ time-frame is 4h.
The price line on GBP/JPY price chart is showing 165.242 at the moment, which would be within the upper half of the bearish channel. Ichimoku Cloud is also placed above the price line, easing the way for the price to go through a descending wave. RSI is currently showing almost 44 and the resistance level on 50, is struggling to stop its ascending wave. Traders can keep an eye on the shorter time frames to detect any bearish trigger. The target for the upcoming descending wave could be considered on 163.000 and 160 after that. Also consider that in case the prie line breaks above the top line of the channel, the chance of an descending trend would highly decrease.
• DISCLAIMER: Please note that the above analysis is not an investment suggestion by “Capitalcore Ltd”. This post has been published only for educational purposes.