The price line is approaching a strong resistance zone
While we are approaching to the release time of Michigan Consumer Sentiment Prel, The price line on EURUSD is moving towards an important resistance zone and some negative signals have appeared on the chart. The price line on this pair is expected to go through a significant wave shortly.
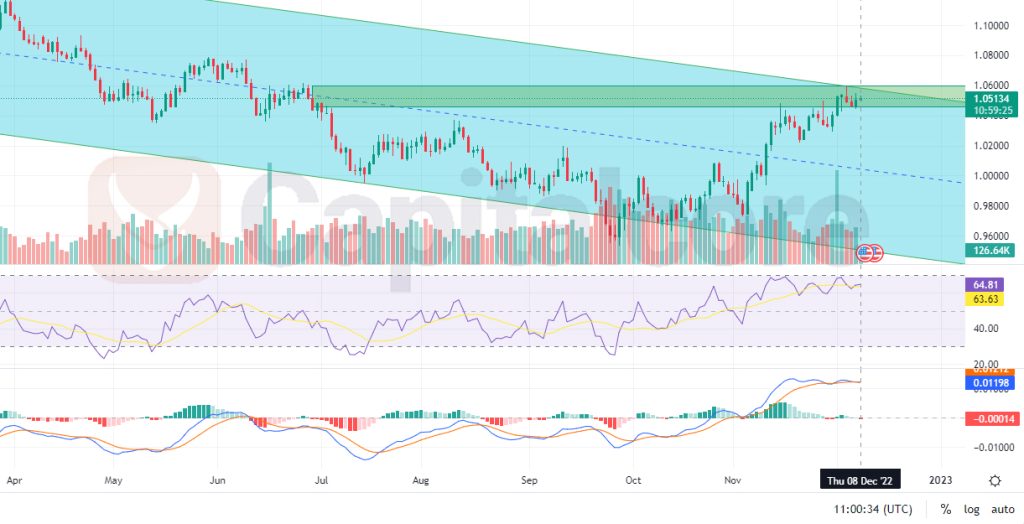
Chart Notes:
• Chart time-zone is UTC (+03:00)
• Candles’ time-frame is 4h.
Since the beginning of June 2022, the EURUSD price line has been descending inside a bearish channel. Although there were some responses from the price line to the middle, lower, and upper lines, this channel has not yet been broken. As a result, it is regarded as a legitimate bearish channel. A potential downturn on the chart is indicated by the RSI’s recent negative divergence signal as it moves closer to the overbought zone. The MACD line and the signal line on the chart crossed when the MACD histogram turned red. Given that it has a lot of supply, the green area on the chart represents a strong resistance level that will likely cause the price to decline. Traders can keep an eye on the price line and anticipate that it will touch the supply zone described earlier. From there, they can place short bets in direction of the 0.96600 and 0.99131 support levels.
• DISCLAIMER: Please note that the above analysis is not an investment suggestion by “Capitalcore Ltd”. This post has been published only for educational purposes.