Volatility in Forex Trading
The forex market can be a volatile and unpredictable environment, and traders must always stay alert to changes in market conditions. One such market to watch is USDZAR, which is currently experiencing a strong resistance level.
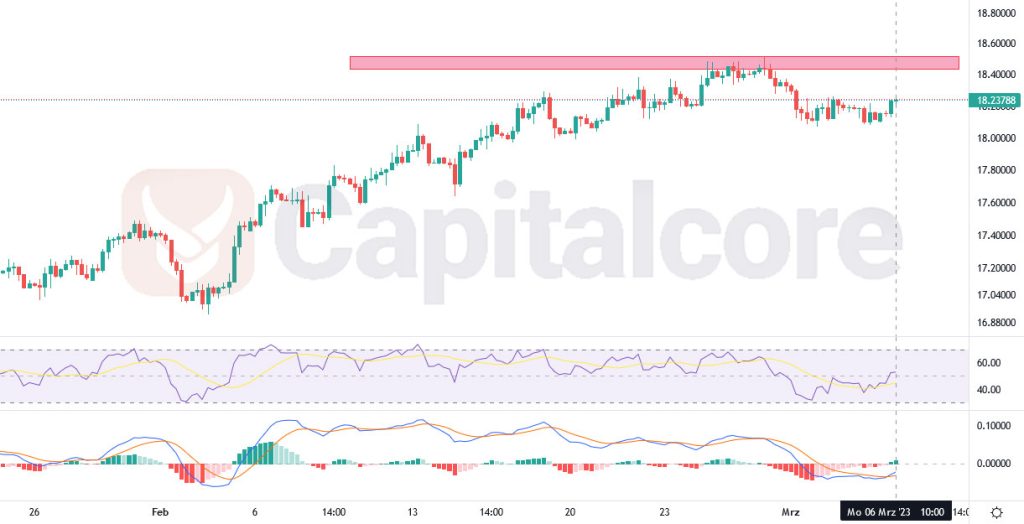
Chart Notes:
• Chart time-zone is UTC (+03:00)
• Candles’ time-frame is 4h.
Currently, the price line of USDZAR is on a very strong resistance level that it reached through a sharp bullish wave. However, the ascending slope of the price movement has decreased, and the candlestick patterns are indicating strong bearish potential. Traders and analysts are expecting a double top formation on the chart, which could signal the end of the bullish phase and the start of a bearish phase. If this happens, we can expect the price of USDZAR to enter a bearish phase, which may present trading opportunities for those looking to short the pair. It will be important to keep an eye on the price action and news events that may impact this forex pair.
• DISCLAIMER: Please note that the above analysis is not an investment suggestion by “Capitalcore Ltd”. This post has been published only for educational purposes.