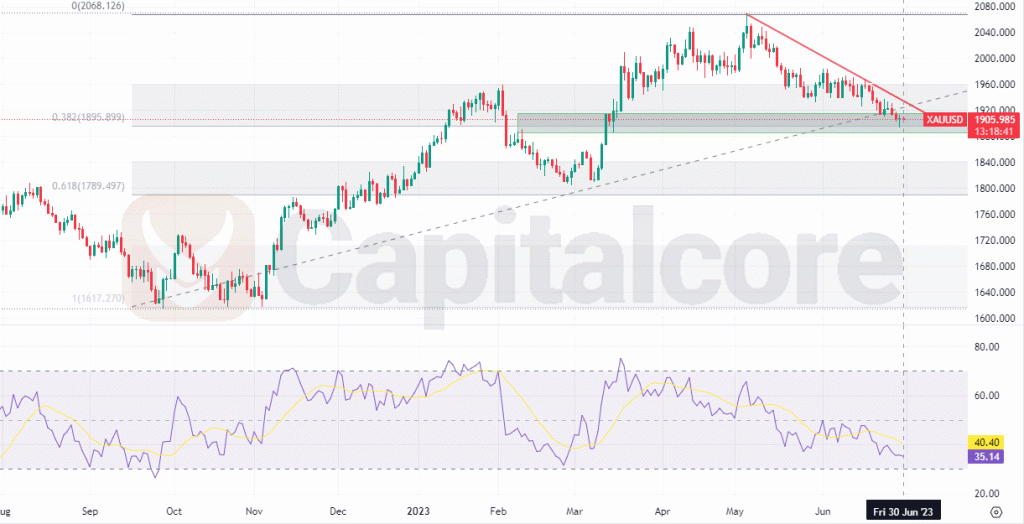
RSI Signals Potential Reversal
Gold is currently experiencing a bearish trend as indicated by the falling Relative Strength Index (RSI) at 38. The RSI suggests that the selling pressure has intensified, potentially indicating further downward momentum.

Chart Notes:
• Chart time-zone is UTC (+03:00)
• Candles’ time-frame is daily.
Traders should monitor the RSI closely for any signs of oversold conditions that might signal a possible reversal. Additionally, there is a significant resistance level at 1933.16, which could act as a barrier preventing further upside movement. Traders should closely observe how the price behaves near this resistance level for potential clues about the strength of the bearish trend. Given the bearish trend, traders may consider looking for short-selling opportunities or adopting a cautious approach until a potential reversal or breakout occurs. Monitoring key support levels and the RSI’s movement will be crucial for assessing the future direction of gold.
• DISCLAIMER: Please note that the above analysis is not an investment suggestion by “Capitalcore Ltd”. This post has been published only for educational purposes.