- Posted By: capadmin
- Category: Market News
Upward Momentum Prevails: EUR/USD
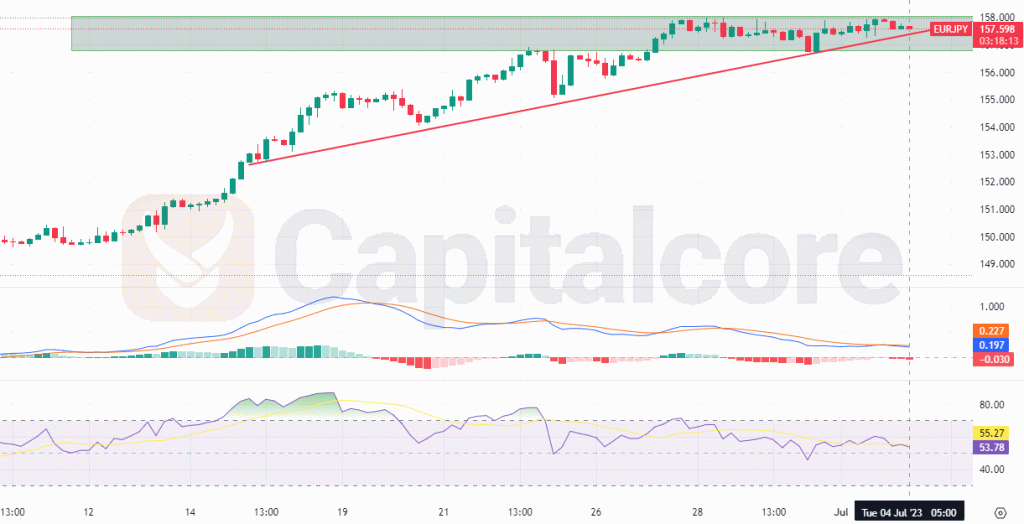
In the EUR/USD pair, the RSI (Relative Strength Index) indicates that the market sentiment is relatively bullish as it is above the 50 levels. This suggests that the buying pressure outweighs the selling pressure. Additionally, the Ichimoku indicator shows a potentially positive outlook as the base and conversion lines align with the candlesticks, indicating support for the bullish momentum.

Chart Notes:
• Chart time-zone is UTC (+03:00)
• Candles’ time-frame is 4h.
Furthermore, the candles are within the green cloud, signaling a favorable environment for buyers. These factors collectively suggest a potentially bullish stance for the EUR/USD pair. However, it’s crucial to consider other factors and conduct further analysis before making trading decisions. The Ichimoku indicator reveals some interesting dynamics. The base and conversion lines align with the candlesticks, which could be seen as a sign of potential support for the bullish momentum. Moreover, the candles are within the green cloud, which traditionally signifies a favorable environment for buyers. On the other hand, the MACD (Moving Average Convergence Divergence) indicator raises some cautionary signals. The signal line has cut the MACD line in a downward direction, and both lines are below the histogram, indicating a potential bearish pressure in the short term. Furthermore, it is worth noting that the baseline cuts the conversion line in an upward direction, suggesting a potential bullish shift. However, the last cloud in the Ichimoku indicator is red, indicating a potential area of resistance or a bearish bias. Traders should exercise caution, monitor price action closely, and consider other factors such as fundamental analysis and market context before making any trading decisions.
• DISCLAIMER: Please note that the above analysis is not an investment suggestion by “Capitalcore Ltd”. This post has been published only for educational purposes.