The price line is on a strong demand level
The price line on EUR/AUD price chart, started a descending rally on 1st of July 2022; as a result of the bearish wave, the price on this pair dumped, up to almost 4.1% until 14th of July 2022. The price line is now on a strong support zone and is expected to go through a trend reversal shortly.
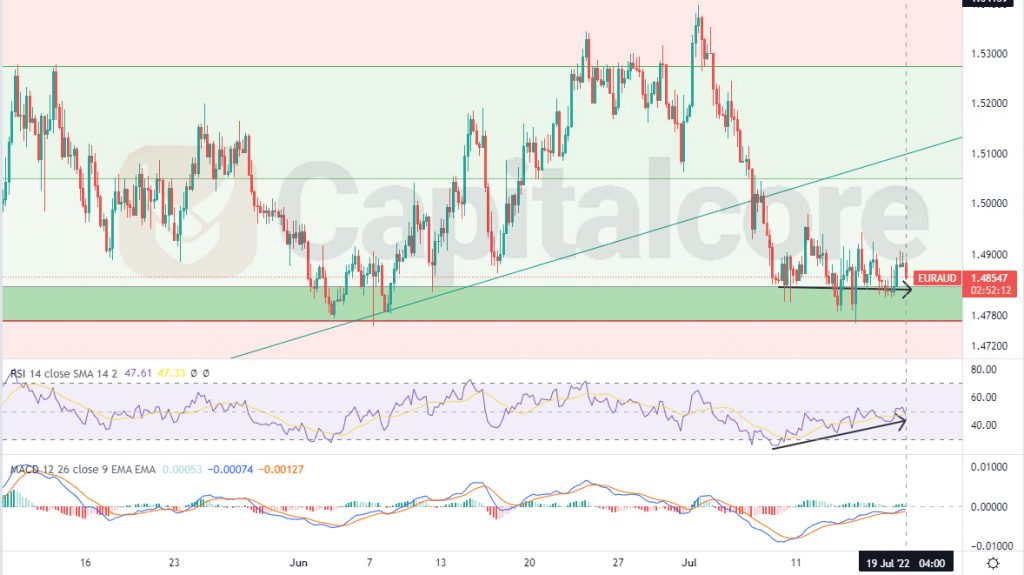
Chart Notes:
• Chart time-zone is UTC (+03:00)
• Candles’ time-frame is 4h.
The price on EUR/AUD is on 1.48547 at the moment, this area is located just above a strong supply zone at 1.476 – 1.484. This zone is considered as a major one, as it has been able to pump the price line several times, therefore is not expected to be lost easily. As it is shown on the chart, the descending slope of the chart has also decreased recently and bullish power is almost over taking the bearish power on the chart. The ascending green line on the chart, indicates the previous major ascending trend line; the price line has already broken below this level, and can have another retest of that. RSI is showing positive divergence and on MACD, MACD line and signal line are about to break above MACD bars. Traders can be waiting for the price line to dump into the support zone, which has been represented as a green zone on the chart; there they can enter long positions heading to 1.504 and 1.527 after that. Please consider that, should the price line break below 1.4745, the bears will again have a higher chance, than bulls.
• DISCLAIMER: Please note that the above analysis is not an investment suggestion by “Capitalcore Ltd”. This post has been published only for educational purposes.