The price line is approaching to a support zone
ETH price line has been going through a bearish wave since 12th of September 2022; within this bearish wave, ETH experienced a 28% lost of value. The price line is now proceeding towards a support zone at 1285 – 1358. This area is expected to support the price as it had been able to do so, several times in the past.
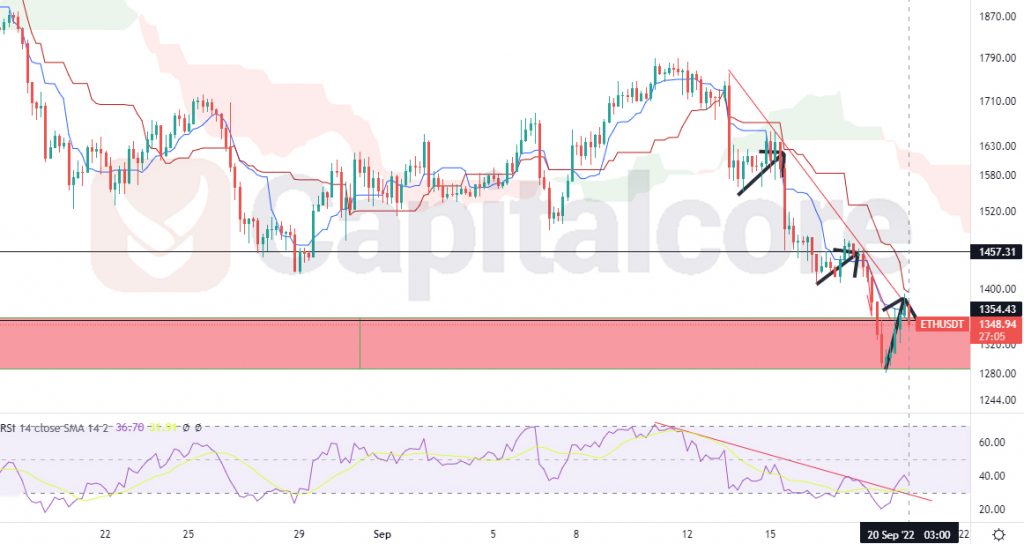
Chart Notes:
• Chart time-zone is UTC (+03:00)
• Candles’ time-frame is 4h.
The red zone below the price line is reflecting the support zone, towards which the price line is is moving. As it is indicated via black arrows on the chart, the bullish legs, within the bearish channel, are getting sharper and stronger over time. RSI has broken above its bearish trend line and this could be considered as an early bullish signal. Ichimoku is still showing bearish trend on going, but MACD line and Signal line are about to have an over cross; in case the over cross appears on the chart, it could be recognized as a bullish signal. Traders can be waiting for the price line to form a double bottom on the chart, where they can enter long positions heading to 1457 and 1635 after that. Please keep in mind that breaking below 1250 could be considered as a momentum for bears and in that case, long positions would not be recommended.
• DISCLAIMER: Please note that the above analysis is not an investment suggestion by “Capitalcore Ltd”. This post has been published only for educational purposes.