Unraveling Ethereum’s Upward Trajectory: A Quick Analysis
Ethereum’s performance against the US dollar on the 4-hour chart presents some intriguing technical indicators. Both the Simple Moving Average (SMA) and Moving Average Convergence Divergence (MACD) indicators are signaling potential bullish momentum for the ETH/USD pair. Here’s a detailed look into what these indicators are suggesting.
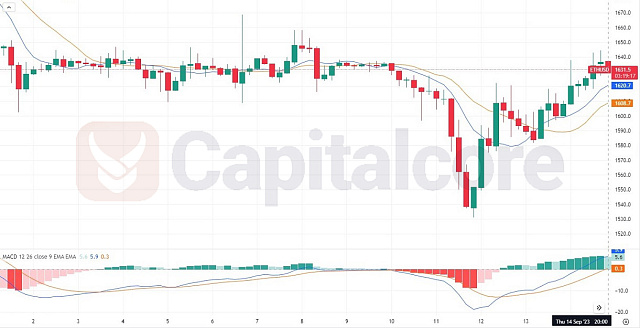
Chart Notes:
• Chart time-zone is UTC (+03:00)
• Candles’ time-frame is 4h.
The short-term SMA crossing above the long-term SMA is a classic bullish signal, indicating a potential upward trend. The MACD line surpassing the signal line reinforces this bullish sentiment, especially with a notable difference between them (5.9 vs. 0.3). The positive histogram value of 5.5 further underscores this upward momentum. Such concurrent bullish signals from both SMA and MACD suggest that ETH/USD may be entering a strong upward trajectory in the short to mid-term. However, traders should always be cautious, consider other market factors, and use stop-losses to protect against unforeseen market reversals.
• DISCLAIMER: Please note that the above analysis is not an investment suggestion by “Capitalcore Ltd”. This post has been published only for educational purposes.