Ethereum’s RSI: Strength in the Bullish Zone
Ethereum (ETH) continues to assert its prominence in the cryptocurrency market with its versatile blockchain capabilities. Against the US Dollar, ETH/USD is a dynamic trading pair, reflecting the ongoing innovations and fluctuations within the broader crypto ecosystem.
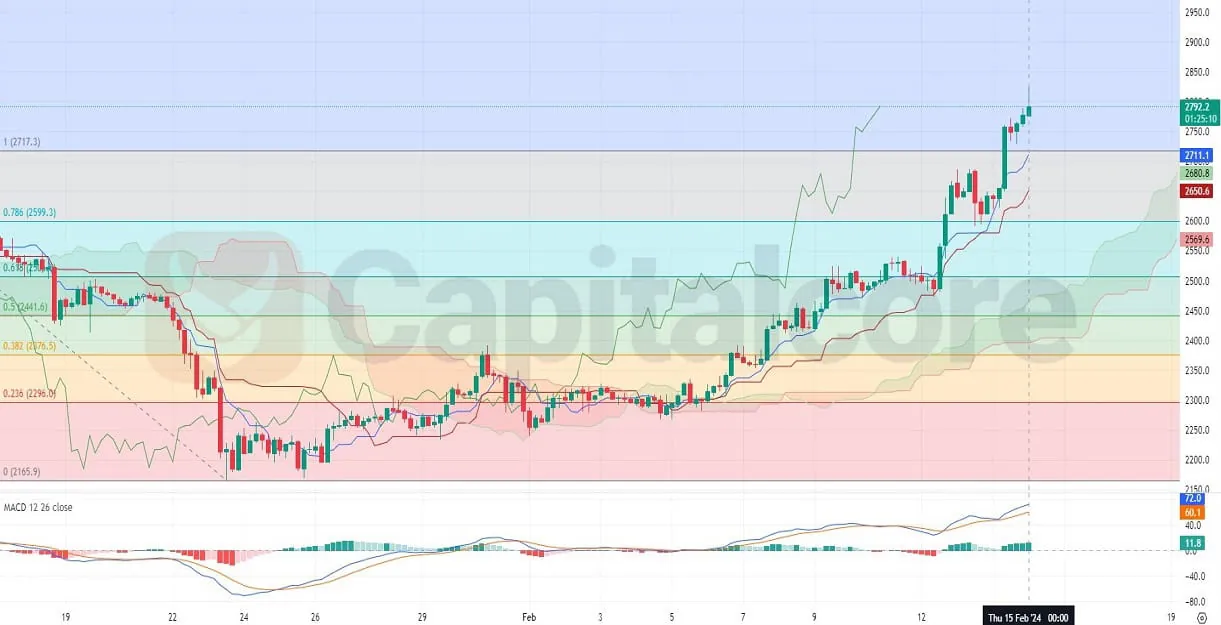
Chart Notes:
• Chart time-zone is UTC (+03:00)
• Candles’ time-frame is 4h.
The ETH/USD pair on the H4 chart displays a strong bullish trend, as indicated by the persistent upward movement and the price’s position above the Ichimoku cloud. The recent candles have closed significantly above the cloud, which traditionally suggests a solid uptrend. The MACD indicator reinforces this bullish sentiment with its positive divergence above the baseline, hinting at sustained upward momentum. Furthermore, the Relative Strength Index (RSI) is in the upper region but not yet in the overbought territory, indicating that there might still be room for growth before a potential pullback. The Fibonacci retracement levels show the price hovering around the 23.6% level, suggesting that if the bullish trend continues, the next significant resistance may be found at the 27.11 level, which aligns with the 0% retracement.
• DISCLAIMER: Please note that the above analysis is not an investment suggestion by “Capitalcore Ltd”. This post has been published only for educational purposes.