H4 Chart Review: ETHUSD’s Dynamic Movements
The ETHUSD pair has been exhibiting volatility on the H4 chart, with a mix of bullish and bearish candlestick formations. This analysis aims to dissect the recent price action and technical indicators to forecast potential market movements.
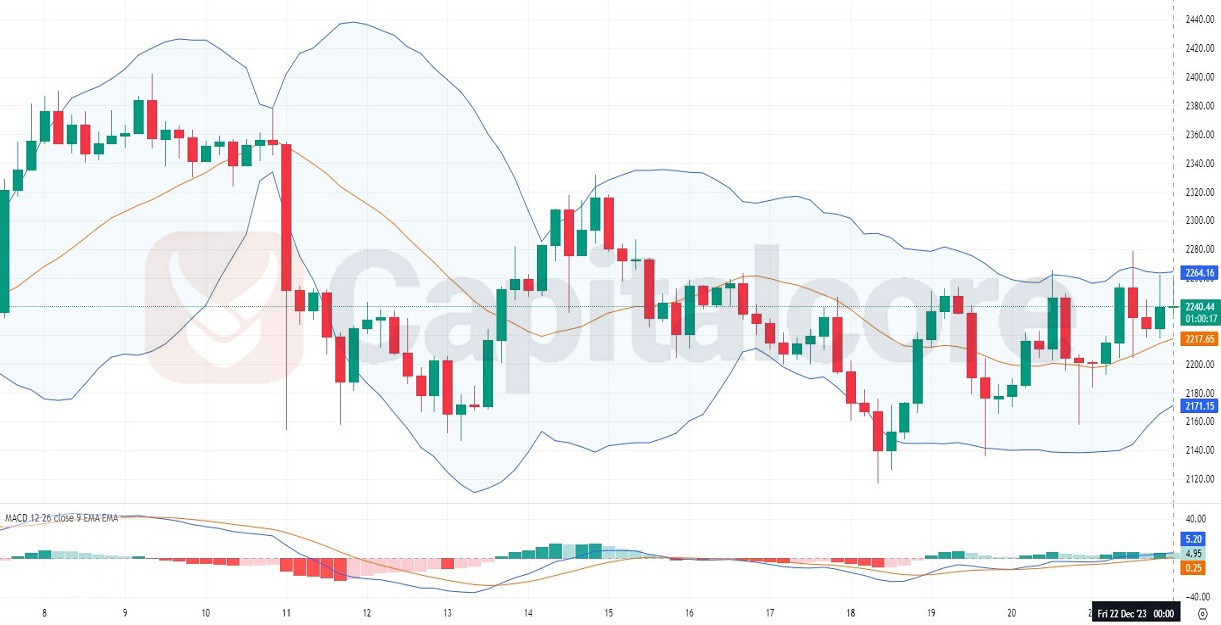
Chart Notes:
• Chart time-zone is UTC (+03:00)
• Candles’ time-frame is 4h.
The H4 timeframe for ETHUSD shows a battle between bulls and bears as depicted by the alternating red and green candlesticks. The market is currently testing the middle Bollinger Band, which often acts as a pivot point for price direction. The Bollinger Bands are moderately wide, suggesting that volatility is higher than usual, which could lead to potential breakouts. The MACD indicator below the chart shows a bearish crossover, with the MACD line crossing below the signal line, hinting at a possible continuation of the downtrend. However, the histogram bars are short and leveling out, indicating a reduction in bearish momentum which could precede a consolidation or reversal. Looking at the moving averages, the price is hovering around the 50-period EMA, which has been acting as dynamic resistance. The crossover of the 50 EMA below the 200 EMA could suggest further bearish potential, but traders would need confirmation from subsequent candlestick patterns and indicator signals.
• DISCLAIMER: Please note that the above analysis is not an investment suggestion by “Capitalcore Ltd”. This post has been published only for educational purposes.