ETHUSD Bullish Reversal
The H4 chart for ETHUSD presents a recent bullish reversal, as evidenced by the last seven dots of the Parabolic SAR indicator positioned below the price candles. This suggests a strong upward momentum, as the Parabolic SAR is commonly used to determine the direction of a trend and potential reversals. The placement below the candles typically indicates a bullish sentiment among traders. Moreover, a series of green candles corroborates this optimistic outlook, indicating buyers’ dominance over sellers in the market.
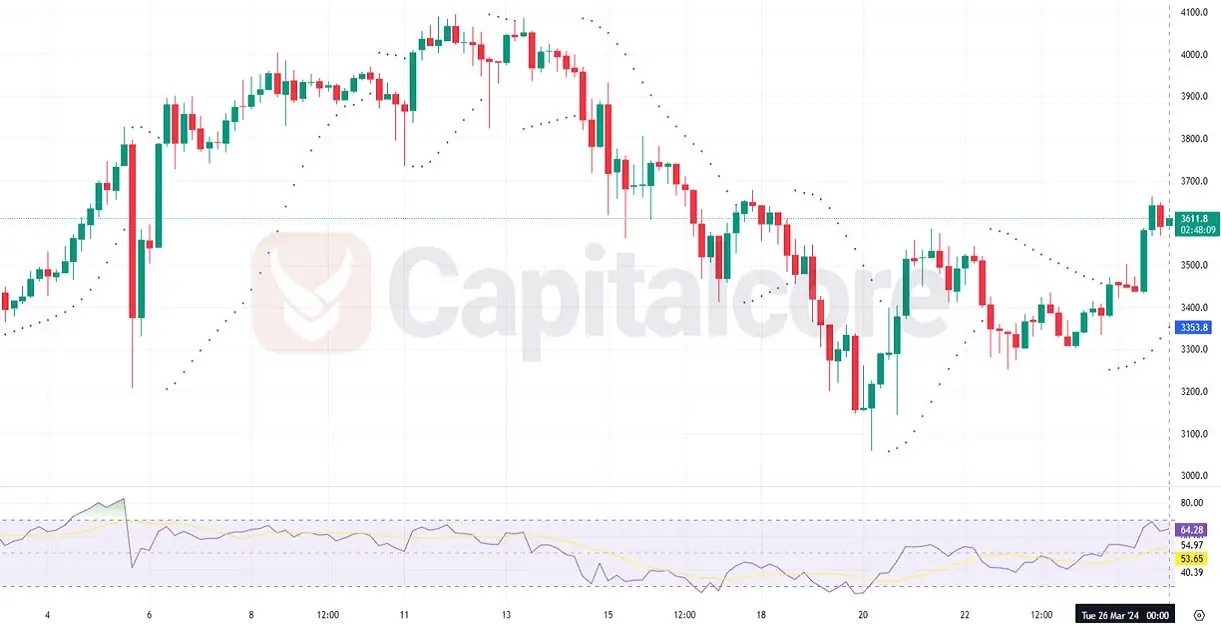
Chart Notes:
• Chart time-zone is UTC (+03:00)
• Candles’ time-frame is 4h.
Delving deeper into the technical analysis, the Relative Strength Index (RSI) is also providing valuable insights. Currently, the RSI is hovering slightly above the mid-line but below the overbought threshold of 70, marking a strong buying pressure without being in the overbought territory. This gives room for potential further upward movement without immediate concerns of being overextended. Additionally, the price action has recently surpassed a previous resistance level, potentially turning it into support. Traders will be watching closely to see if this level holds during pullbacks. With the trend’s momentum indicated by the Parabolic SAR and the supportive RSI readings, the market sentiment for ETHUSD on the H4 timeframe seems cautiously optimistic for continued upward movement, barring any adverse market news or events that could disrupt the current trajectory.
• DISCLAIMER: Please note that the above analysis is not an investment suggestion by “Capitalcore Ltd”. This post has been published only for educational purposes.