The price line is on a strong resistance level
After several weeks of bullish market, the price line on EUR/AUD price chart is now approaching a strong resistance level. Different indicators are issuing negative signal and despite several weekly-ascending-candles, the momentum is still with bears. The next bearish leg is about to occur.
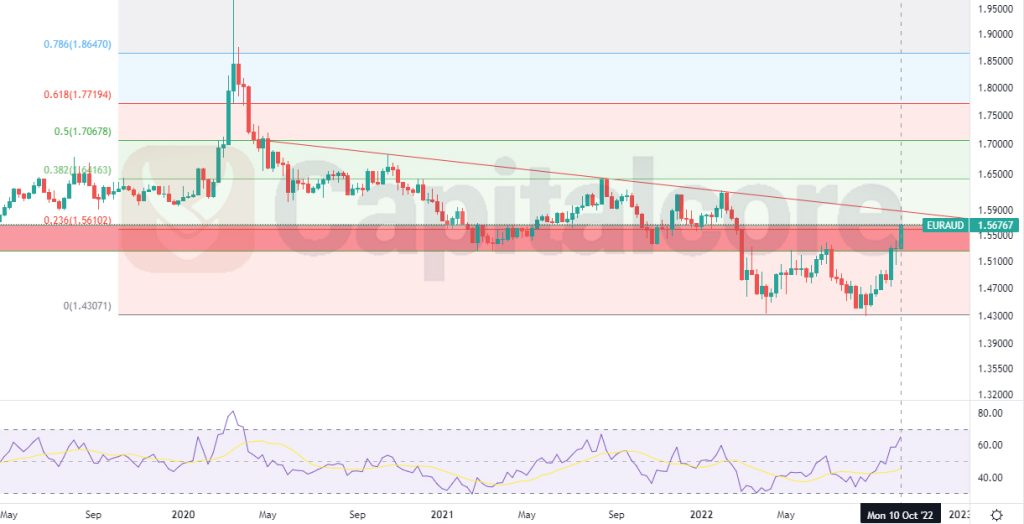
Chart Notes:
• Chart time-zone is UTC (+03:00)
• Candles’ time-frame is weekly.
The price line on EUR/AUD price chart was closed at 1.56767, which would be located just below the resistance level at about 1.55000. The mentioned resistance level is reflected as a light red box below the price line. This area is considered important for traders as it has been able to act as a support zone for the price line, and also has recently converted to a resistance zone, recording a successful dump. The descending red line, reflects the long term trend line, which has not been broken yet, meaning that the momentum is still with bears, despite several weeks of bullish market. Traders can expect bearish candles in the upcoming days; and therefore Sell positions would have a higher chance of winning.
• DISCLAIMER: Please note that the above analysis is not an investment suggestion by “Capitalcore Ltd”. This post has been published only for educational purposes.