The price line is about to form the next wave
After a strong bearish wave, the price line on EURCAD price chart started moving sideways between the pink and the green zone on the chart. In its previous bullish leg, the price line could finally put an end to the bearish trend and is now looking bullish.
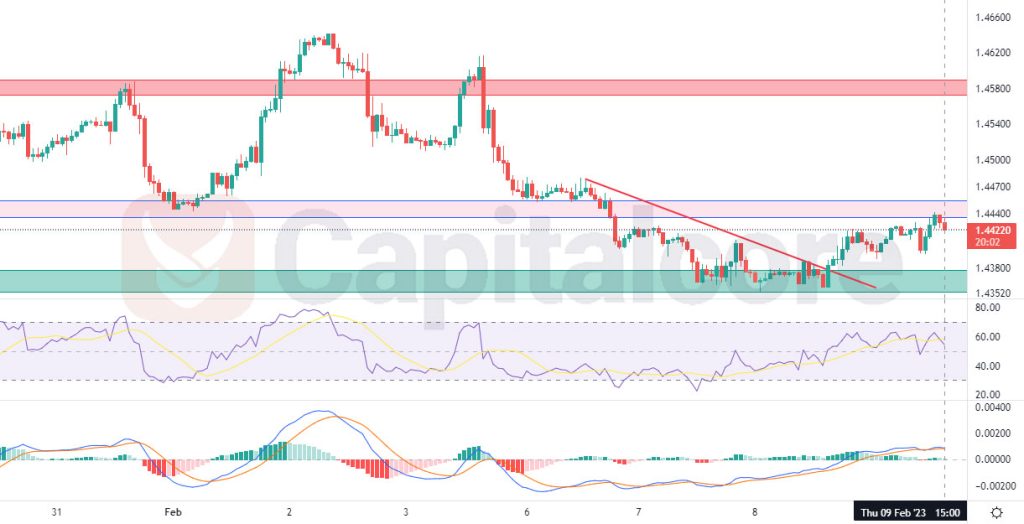
Chart Notes:
• Chart time-zone is UTC (+03:00)
• Candles’ time-frame is 1h.
At the moment, the price line is testing the newly formed resistance level at almost 1.44400; this level has converted from a broken support zone into a resistance zone and does not look to include enough sell positions to stop the formed bullish trend. The price line is most possibly on the way to have another retest of the green support zone and from there, it could be expected to continue its bullish trend until it reaches to the red resistance level. RSI has already gone through a strong ascending wave and the price line is lagging behind; this could also impower the possibility of an upcoming bullish wave. Buyers can set orders on the green zone and hope to see the price line on 1.45200 and 1.45760 after that.
• DISCLAIMER: Please note that the above analysis is not an investment suggestion by “Capitalcore Ltd”. This post has been published only for educational purposes.