- January 23, 2023
- Category: Market News
A descending wave seems to be close
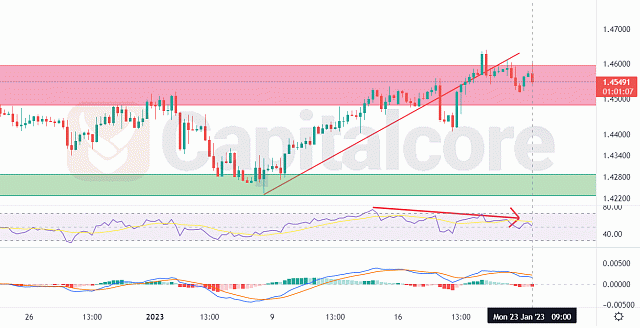
EUR/CAD started moving sideways, after the major bullish wave that it had been through. The bullish power looks to be descending significantly and different indicators are issuing descending signals. A bearish wave could be expected to come shortly.

Chart Notes:
• Chart time-zone is UTC (+03:00)
• Candles’ time-frame is 4h.
On November 4, 2022, EURCAD started moving upwards. This trend still dominates the price chart. There are several factors that indicate an imminent trend reversal is likely. A bearish wave is likely to form. The upward slope of the chart has recently started to decrease. The price line has already broken below the bullish short-term trend line. The mentioned level is shown as a blue rising channel on the chart. The MACD histogram is slightly reddish during the crossings of the MACD line and the signal line, sending a negative signal. Potentially important resistance areas are indicated by red boxes above the price line. To enter short his position, the seller should look at the chart and wait for a bearish trigger to be pulled.
• DISCLAIMER: Please note that the above analysis is not an investment suggestion by “Capitalcore Ltd”. This post has been published only for educational purposes.